A tempo-spatial controllable microfluidic shear-stress generator for in-vitro mimicking of the thrombus | Journal of Nanobiotechnology
Membrane deformation and resulted flow resistance
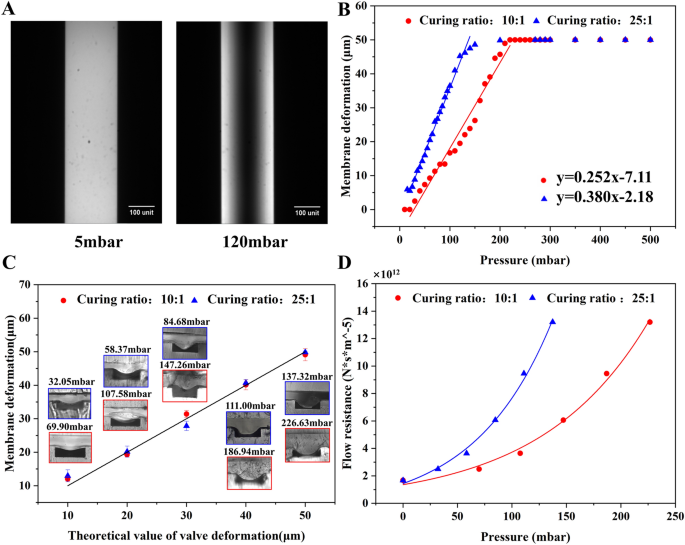
The relative degree of membrane deformation was indirectly quantified by characterizing the fluorescence intensity. As the deflection of the membrane, the volume and the intensity of the fluorescence liquid under the membrane decreased. Figure 2A shows the fluorescence images of channels with the membrane (curing ratio of 10:1) deflected under 5 mbar and 120 mbar. It was evident that irrespective of the curing ratio, a linear relationship existed between the membrane deformation (y) and the applied pressure (x) until the membrane deflected 50 μm to contact the channel floor (Fig. 2B). The linear regression models were y = 0.258x − 7.11 and y = 0.380x − 2.18 for the curing ratio of 10:1 and 25:1, respectively. The linear correlation reveals that the membrane adheres to Hooke’s law, which states that stress and strain in a material exhibit a linear relationship within the elastic range. Additionally, the fitted line associated with the 25:1 membrane had a larger slope, since it possessed a smaller Young’s modulus. This 25:1 membrane was more susceptible to deform owing to its smaller Young’s modulus.
The studies of membrane deformation and flow resistance. A The microscopic images of the fluorescent liquid in channels with the membrane (curing ratio of 25:1) under distinct pressure. The deformation of membrane under various pressure determined by B fluorescence imaging and C cross section imaging. D The flow resistance of the constricted region when the membrane deflected 10–50 μm at various pressure
To validate the experiment’s accuracy, comsol software was employed to simulate the membrane deformation under varied pressure conditions. Detailed results are presented in Additional file 1: Figure S2. Additional file 1: Figures S2E and H reveal a remarkable concordance between the simulated scatter plots of membrane deformation under different pressure conditions and the experimental fitting curves. Through a comprehensive synthesis of simulation and experimental data, the corresponding pressure was obtained for membrane deformations of 10, 20, 30, 40, and 50 μm (see Additional file 1: Table S2).
Figure 2C illustrates the cross-sectional photos of the constriction region and magnitude of deformation induced by the cured UV resin which were injected and cured at the pressure acquired from Fig. 2B. The deflection exhibited a parabolic shape with greater deformation in the middle and small deformation on both sides (Fig. 2C). Additionally, the membrane deformation was of small errors under the same pressure condition. It revealed that the actual deformation caused by resin closely resembled the pneumatic driven deformation measured using the fluorescent liquid. Therefore, it is possible to predict the exact pressure inducing the desired membrane deformation using the regression models in the Fig. 2B.
Given the irregular constriction of the channel owing to the membrane deformation, it was crucial to simulate the flow within the deformed channel to obtain flow resistance. As depicted in Fig. 2D and Additional file 1: Figure S3D, the flow resistance of the constriction region was proportional to the pressure (or the membrane deflection) regardless of the curing ratio of the membrane. For the given pressure, the membrane with less curing agent (25:1) resulted in larger flow resistance, since it deflected to a larger extent in comparison to that with more curing agent (10:1).
The precise control of the flow resistance relies on the accurate deformation of the membrane. However, measurement of the deformation is challenging and mainly by either numerical simulation or imaging. For instance, simulation revealed that 2000 mbar was necessary to deflect a 20 μm thick film (with a curing ratio of 10:1) for by 30 μm [56, 57]. The confocal microscopy has been employed for a more intuitive visualization of membrane deformation [48]. It reported that under a pressure of 2000 mbar, a film with a thickness of 10 μm deforms for approximately 15 μm.
This paper measured the deformation by imaging both fluorescence liquid and the cross section. Although the former one was indirect visualization, both methods are accurate and repeatable. Additionally, the observed variations between the pressure for the membrane deflection in different articles can be attributed to several factors, for example, the differences in the membrane production process (such as curing ratio, curing temperature, and time), the thickness, width and length of the membrane.
Predication of shear stress combinations
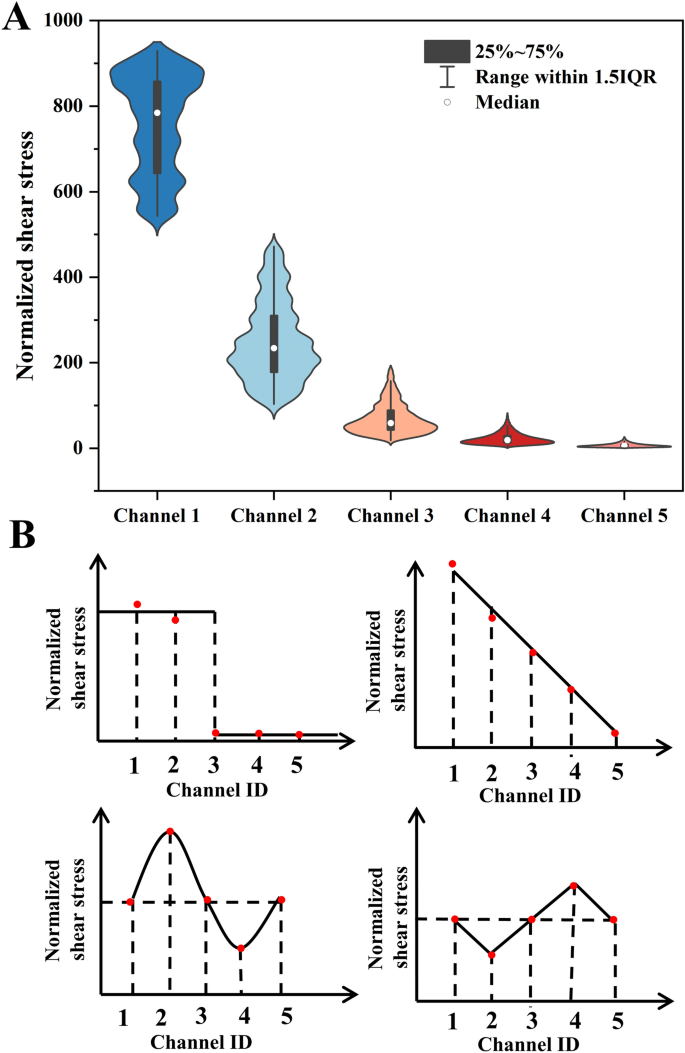
The flow resistance of microfluidic channels can usually be analogous to resistors connected either in parallel or in serials in digital circuit (see Additional file 1: Figure S1B). Additional file 1: Table S4 presents the calculated flow resistance values of different regions in the microfluidic chip. For the given inlet flow rate, the device was able to create 7776 flow rate combinations by varying the membrane deformation with the step of 10 µm in each branch channel. The shear stress (Fig. 3A) of the above combinations was calculated by Matlab and normalized to the minimal shear stress in Channel 5 when the membrane deflected for 0, 0, 0, 0 and 50 µm for the channel 1 to 5, respectively. The ratio between the maximum and the minimum shear stress generated by the device was 929 (Fig. 3A and Additional file 1: Table S5). In another word, the device was able to create shear stress with 1–929 times variation merely by varying the membrane deflection of 5 branch channels. For the given combination of deformations, the microfluidic chip generates maximum and minimum shear stress gradients of 874 and 20 times, respectively (see Additional file 1: Table S6).
Additionally, the device was able to create precisely designed shear stress profiles across branch channels by varying the degree of membrane deformation. For example, the square, linear, sine and Jaggise varied profile of shear stress in five branch channels (Fig. 3B). The required membrane deformation and the flow rates in the five branch channels were summarized in Additional file 1: Table S7. If the inlet flow rate was altered, the magnitude of the shear stress may increase in each branch channel, but the ratio of the shear stress was constant once the membrane deflection was fixed. For instance, if the inlet flow rate raised 100%, the magnitude of the shear stress in each channel doubled regardless of the profile of the combination (Fig. 3B). To modify the shear stress profile the membrane deformation combination should be altered.
Shear stress variation based on the alteration of local size along the channel was a straightforward and most frequently used method, it lacked the ability to dynamically adjust the once the SU-8 mould was manufactured. Hence, the microvalve is employed to dynamically control the cross-sectional shape, precisely regulating the flow resistance within the channel and enabling real-time adjustments to the shear stress within the chip [29]. Moreover, by dynamically controlling the valve deformation, the flow pattern can be precisely regulated to effectively simulate various flow microenvironments [44]. However, this method demands continuous pressure to maintain deformation of the microvalves, thereby increasing the complexity of the experimental process. The method in this paper enabled permanent membrane deformation using UV resin injected at a given pressure after the fabrication of the PDMS device. Although it was limited in the real-time adjustment of membrane deformation in the same PDMS device, it only required one SU-8 mould (by photolithography) and was able to manufacture devices with hundreds of deformation combinations. Therefore, it may be used to generate shear stress in a large range.
Numerical and experimental studies of the flow field
Besides the calculation of shear stress based on analysis of the flow rates in the above section, it was further validated using both numerical simulation and µPIV measurement. The intersection areas between branch channels and the main channel from both simulation and experiments (Additional file 1: Figures S4 and S5) demonstrated significant effect of flow shunting regardless of the presence of the constriction. Due to the mass conservation nature, the flow through any section in the same branch channel was constant. The shear stress at the up and downstream of the constriction was identical. However, the constriction altered the flow resistance and thus the flow rate in all branch channels (see velocity contours in Additional file 1: Figure S6).
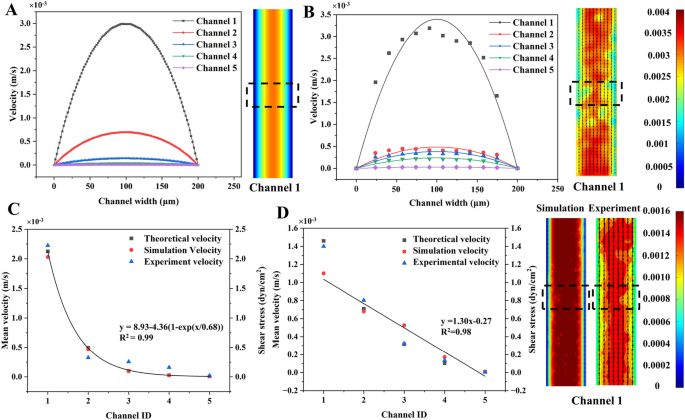
Figure 4A and B showed the velocity profiles obtained respectively by simulation and µPIV using the devices without constriction when the inlet flow rate was 1.67 µL/min (0.00278 m/s). The insets showed velocity contours and the regions (dotted boxes) for velocity calculation across the width of the channel. The velocity across the width was of a parabolic profile with maximum in the channel center due to the laminar flow nature. The lines in Fig. 4B represent the parabolic models (see Additional file 1: Table S8) fitted to the µPIV data. The R2 of all models ranged from 0.79 to 0.94, suggesting the velocity distribution across the channel met the characteristic of laminar flow.
The study of the flow field in branch channels. The velocity profiles (across the channel width) acquired from A simulation and B µPIV measurement in the 5 channels without membrane deformation. C The velocity and shear stress in 5 branch channels without membrane deformation. D The flow velocity and shear stress in branch channels when the membrane deformed 50 μm, 40 μm, 10 μm, 0 μm and 50 μm in Channel 1 to 5, respectively. Insets showed the velocity contours from simulation and experiment
The mean velocity of 5 channels in devices either without (Fig. 4C) or with constriction (Fig. 4D) were acquired by analytical calculation, simulation, and experiment. As the shunt effect of the branch channels in Fig. 4C, the mean velocity (shear stress) drastically decreased from 2.03 × 10⁻³ m/s (2.03 dyn/cm2) in Channel 1 to 7.09 × 10⁻⁶ m/s (7.09 × 10⁻³ dyn/cm2) in Channel 5 although the membrane was not deflected. The shear stress was determined by the Channel ID using an exponential decay model of y = 8.93 − 4.36(1 − exp(x/0.68)) (R2 = 0.99). However, the mean velocity (shear stress) linearly decreased 99.7% (99.7%) from Channel 1 to Channel 5 in devices with constriction (Fig. 4D). The relationship between shear stress and the channel ID was described by y = 1.30x − 0.27 (R2 = 0.98). The devices without and with constrictions were able to correspondingly generate 284.8- and 109.2-times shear stress variation across five channels. Thus, they were employed to examine the shear influence on HUVECs in the last section.
In both Fig. 4 C and D, there was 8.7–21.4% difference between the simulation and the experiment. However, the difference between the experiment and the analytical analysis was 11.6–14.4%. The variation between the velocity acquired by distinct methods might be related to the simplification in simulation and the hydraulic resistance equation in analytical analysis. Additionally, micro-scale effects, such as interference between the fluorescent sample and the wall, wall friction, and surface tension, also contribute to errors in the micro-PIV measurements near the wall s [58, 59]. Therefore, this study employed the simulation to determine the velocity and hence the shear stress in each channel in the following sections.
Shear influence on endothelial cells morphology
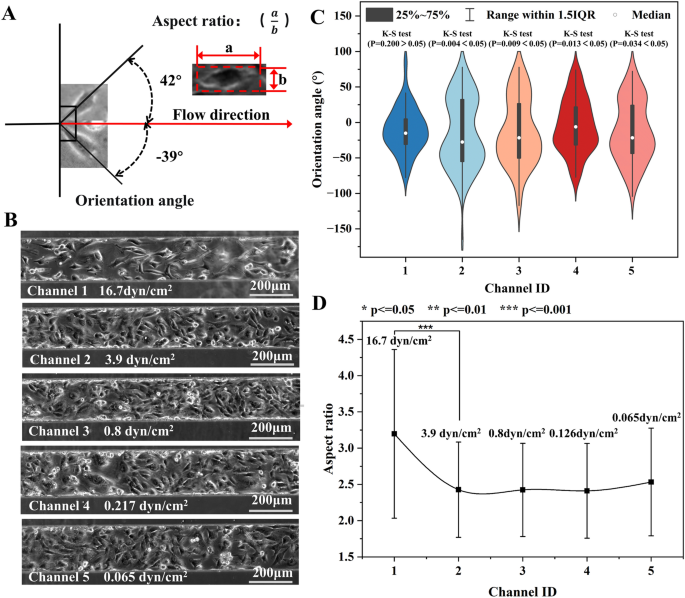
The devices generating both exponential (0.065–16.7 dyn/cm2) and linear (0.153–16.7 dyn/cm2) decreasing shear stress in 5 branch channels were employed to study the effect 24-h shear exposure on HUVECs. The shear stress in each channel and the relevant physiological condition were summarized in Additional file 1: Table S9. The effect of shear stress on cell morphology was quantitatively investigated by analyzing both the orientation angle and the aspect ratio of cells. As shown in Fig. 5A, the orientation angle referred to the accurate angle between the long axis of the cell and the flow direction. The aspect ratio represented the ratio between the length and the width of the cell.
The morphology of HUVECs in devices without membrane deformation (Exponential decreasing shear profile). A The schematic diagram showing the orientation angle and aspect ratio of cells. B The phase contrast photos of HUVECs in 5 channels with various shear stress for 24h. C The orientation angle distribution of cells (N = 89–194). D The aspect ratio of cells in five branch channels with distinct shear stress
Figure 5B illustrated the micro photos of HUVCEs in the shear stress of 0.065–16.7 dyn/cm2. The photos suggested that more cells realigned along the flow direction at higher shear stress. The orientation angle of cells (N = 89–187) in each channel was shown in Fig. 5C. The mean orientation angle of cells in Channel 1 (16.7 dyn/cm2) and Channel 2–5 was 26.4°and 34.6–42.0°, respectively. One-way ANOVA (P = 0.15–0.78) suggested no significantly difference between the mean orientation angles in the last four channels. Moreover, only the orientation angle of cells in Channel 1 was normally distributed according to K-S test (p = 0.2), while the others were randomly orientated (p = 0.004–0.034). Similarly, the mean aspect ratio of cells in Channel 1 and Channel 2–5 was 3.20 and 2.41–2.53, respectively. No significant difference was found in the aspect ratio in the last four channels (p = 0.10–0.96).
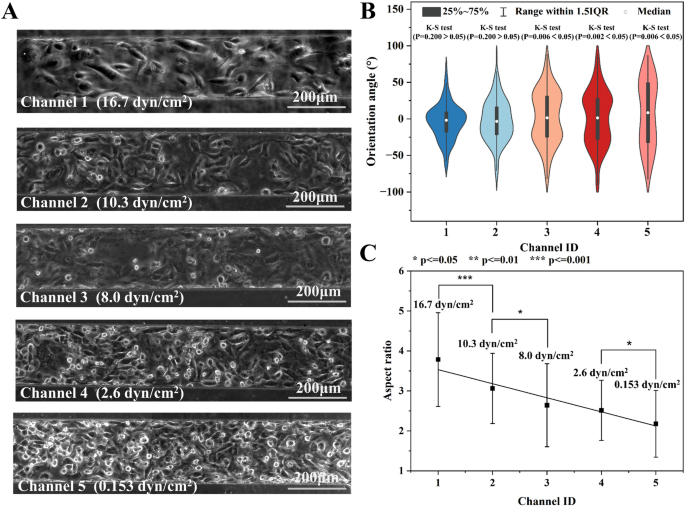
Afterward, this paper showcased the precise regulation of shear stress in the five branch channels by controlling the membrane deformation, before studying the impact of large-range shear stress on cells. Figure 6A provided visual insights into the cellular response to the 24-h shear stress ranging from 0.153–16.7 dyn/cm2. Figure 6B illustrates the distribution of orientation angles for cells (N = 82–189) in each channel. The mean orientation angles for Channel 1–5 were 18.5°, 22.9°, 30.9°, 31.8°, and 40.4°, respectively. The K-S test revealed that the orientation angles of cells in Channel 1 and Channel 2 followed a normal distribution (p = 0.2 > 0.05). On the other hand, those in the remaining channels exhibited a random distribution (p < 0.05). Moreover, the average aspect ratios of cells in Channel 1–5 were 3.79, 3.06, 2.64, 2.51, and 2.18, respectively (Fig. 6C). Although there were large standard deviations, significant difference in aspect ratios was found for any two adjacent channels, except for those in channels 3 and 4.
The morphology analysis of HUVECs exposed to shear stress for 24 h in devices with membrane deformation. A The micro photos of cell in five channels. B The orientation angle distribution and C the aspect ratio of cells (N = 122, 199, 187, 181, and 114) in five branch channels with distinct shear stress. The shear stress of 16.7 and 10.3 dyn/cm2 significantly affect cell orientation
Cell morphology is often studied using two primary parameters: cell aspect ratio and orientation angle, which provide insights into cell arrangement under shear stress. The latter one is particularly intuitive in characterizing cell organization. For example, the frequency of applied pulsating shear stress has a notable effect on the orientation angle of endothelial cells. Specifically, higher frequencies, such as 2 Hz, lead to a smaller positioning angle, causing the cells to align more towards the flow direction compared to lower frequencies of 0.25 and 0.75 Hz [60]. Moreover, the magnitude of the shear stress also plays a significant role in determining the distribution angle of endothelial cells. Applying shear stress ranging from 4 to 16 dyn/cm2 results in a gradual reduction of the orientation angle [61]. Interestingly, a larger shear stress of 10 dyn/cm2 tends to bring the positioning angle of the cells closer to a normal distribution in contrast to the smaller shear stress of 2 dyn/cm2 [33]. This phenomenon extends to other cell types as well, including fibroblasts [24, 29], stem cells [29], and osteoblasts [62]. Furthermore, the aspect ratio of a cell also responds to shear stress as a crucial cell size parameter. For instance, stem cells exhibit a certain level of shape response under a shear stress of 0.02 dyn/cm2, with a smaller cell aspect ratio observed at the shear stress of 0.022 dyn/cm2 [6]. Similarly, in the case of endothelial cells, the aspect ratio of the cells increases with higher shear stress ranging from 4 to 16 dyn/cm2 [61].
Therefore, it can be reasonably inferred that shear stress larger than 10 dyn/cm2 (equivalent to that in veins) had a significant impact on the cellular arrangement. Cells tended to align more closely with the direction of fluid shear stress, resulting in a normal distribution. Conversely, the low shear stress less than 8 dyn/cm2 (equivalent to that in the arteries) did not exert a significant influence on cell arrangement (as shown in Additional file 1: Figure S7). Moreover, the shear stress had a greater impact on the cell aspect ratio compared to its orientation angle. The obtained results exhibited similarity to the findings reported by DeStefano [61] and Arora [29] et al. In summary, the investigate on of cell morphology using cell aspect ratio and orientation angle, particularly under the influence of shear stress, provided valuable insights into the behavior of various cell types. These findings have implications for understanding cellular responses to mechanical stimuli and contribute to the broader understanding of cell biology.
Blood vessel damage in thrombosis model
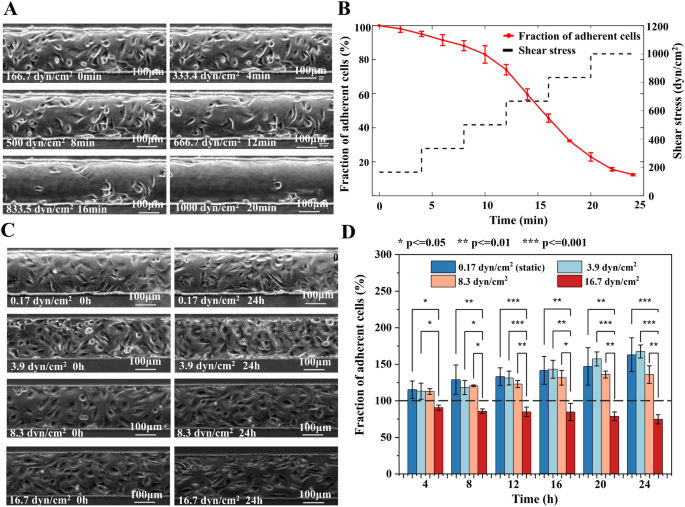
The adhesion of endothelial cells is critical for the physiological processes such as embryonic development, tissue homeostasis, and pathological conditions. Moreover, investigating the adhesion of cells under distinct magnitude and exposure time of shear stress has important implications for the long-term on-chip culturing of HUVECs. The short-term exposure of cells to high shear stress was firstly assessed to understand the possible influence of specific pathological flows (such as flow during thrombus formation) on endothelial cells. Figure 7A and Additional file 2: Video S1 showed the morphology change and detachment (decrease in number) of HUVECs as the shear stress raised from 166.7 to 1000 dyn/cm2. During the normal culture with media perfused at the shear stress of 0.17 dyn/cm2, the cells continuously divided and migrated on the channel floor to confluence. However, 5.0% cells especially in the middle of the channel were peeled off the floor and flushed away from the field of view when they were exposed to the shear stress of 166.7 dyn/cm2 for 4 min (Fig. 7B). While the shear stress was further increased to 333.4, 500, 666.7, 833.5, and 1000 dyn/cm2 and was maintained at each stage for 4 min, there were 88.2%, 74.0%, 45.7%, 22.9%, and 12.4% HUVECs remaining adherent on the floor of the channel, respectively. Research on arterial vascular disease indicates that abnormal constriction or narrowing of normal arteries and arterioles can significantly alter their hemodynamic conditions compared to healthy vessels. For instance, a 95% arterial constriction can generate shear stress exceeding 1000 dyn/cm2 [2]. The findings of this study demonstrate that under the influence of high shear stress, a considerable number of cells detach rapidly. Consequently, at sites where arteries undergo abnormal constriction, blood vessels may sustain certain levels of damage, increasing the risk of vessel rupture and bleeding [63, 64]. Furthermore, studies have revealed that elevated shear stress can stimulate platelet aggregation, further heightening the risk of stroke.
The cell attachment strength study. A The micro photos and B the percentage of HUVECs remaining adhered to the channel exposed to increasing shear stress for various time periods. Each shear stress lasted four minutes before further increase. C The micro photos and D number of adhered cells in channels with different shear stress (0.17, 3.9, 8.3, and 16.7 dyn/cm2) for upto 24 h
Additionally, the long-term exposure of cells to low shear stress was studied to understand the effect of human physiological flow on endothelial cells. Figure 7C showed the micro photos of cells cultured either before or 24 h after application of the shear stress from 0.17 to 16.7 dyn/cm2. As presented in Fig. 7D, Additional file 1: Figure S8 and Additional file 3: Video S2, when subjected to venous shear stresses of 0.17 dyn/cm2, 3.9 dyn/cm2 and 8.3 dyn/cm2 for 24 h, the cell quantity notably increased 62.7%, 67.2%, and 35.6%, respectively. However, the cell number in the field of view experienced a substantial decrease of 25.5% at the shear stress of 16.7 dyn/cm2. Additionally, the number of cells exposed the former two shear stress for the same time period has no significant difference (p = 0.45–0.90). This suggested that the shear increase did not affect the cell proliferation nor the adhesion. According to ANOVA, the fraction of adherent cells under venous shear stress of 0.17, 3.9, and 8.3 dyn/cm2 significantly differed from that under arterial shear stress of 16.7 dyn/cm2 within each time period (Fig. 7D). At 8.3 dyn/cm2 some of the cells were flushed away during division, but the spread cells still adhered to the floor and cell number still raised. Whereas, at the 16.7 dyn/cm2, most dividing cells and even some spread cells were detached by the flow which contributed to the obvious cell number reduction. Atherosclerosis commonly affects arterial branches. Under normal physiological conditions, the shear stress in arteries is approximately 10 dyn/cm2 [65]. The microfluidic chip proposed in this study simulates the flow conditions in the presence of a thrombus by modulating the film deformation, and the simulation results demonstrating the corresponding changes in shear stress are presented in Additional file 1: Figure S9. Additional file 1: Figure S9C illustrates that for patients with mild arterial blockage (around 20%), the shear stress reaches approximately 16.7 dyn/cm2. In clinical practice, mild stenosis may not exhibit obvious symptoms. However, our findings indicate that even under a prolonged shear stress of 16.7 dyn/cm2, the number of adherent cells decreases. Consequently, patients with mild blood vessel blockages are still at risk of blood vessel rupture and bleeding. Moreover, in the absence of clinical symptoms, the risk may be even greater.
Through the application of a microfluidic chip to generate shear stress, the researchers observed that both the magnitude of the shear stress and the surface density of fibronectin have an impact on cell adhesion. Specifically, when the shear stress reached 4000 dyn/cm2, approximately 80% of the cells detached from the surface within 4 min. Similarly, nearly 80% of the cells were detached from the glass within 24 min As the shear stress is gradually increased from 0 to 1600 dyn/cm2 [66]. Moreover, the mode of shear stress application impacts cell adhesion. At 10.7 dyne/cm2 within 24 h, a moderate and gradual increase (10% increase/h) resulted in 43% higher cell retention compared to a severe and rapid increase (15% increase/h) [67]. The researchers discovered that TNF-a plays a crucial role in cell adhesion under shear stress [68]. Additionally, enhanced fibronectin assembly leads to increased endothelial cells adhesion by upregulating integrin β1 and focal adhesion kinase expression. This highlights the underlying mechanisms of shear impact on cell adhesion [67].
Although the adhesion force of cells on the substrate may vary slightly due to the type of cells, substrate materials and the protein priming on the substrate. The detachment study is of great significance for evaluating the effect of shear stress on cell adhesion. These observations highlight the sensitivity of cell adhesion to the duration and magnitude of shear stress. Elevated shear stress and prolonged exposure time may result in substantial detachment of cells and lower growth rate. For example, the doubling time of cells at static culture was measured to be 19.71 ± 12.4 h [69], further supporting the notion that the two venous shear stress conditions did not significantly alter cell growth dynamics over the long term.


