Achieving deep intratumoral penetration and multimodal combined therapy for tumor through algal photosynthesis | Journal of Nanobiotechnology
Synthesis and Characterization
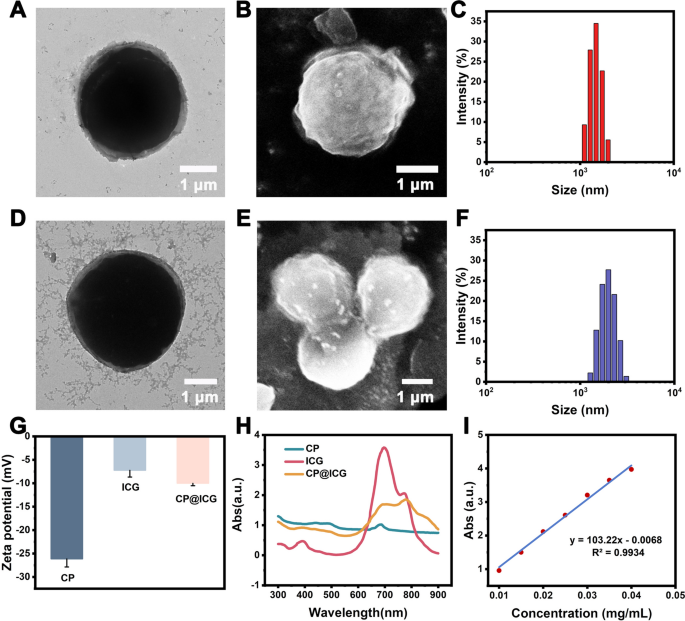
In the characterization via transmission electron microscopy (TEM), scanning electron microscopy (SEM), and conventional optical microscopy, CP exhibited a regular spherical structure (Fig. 1A, B). The cytoplasm appeared green (Additional file 1: Fig. S1), and it was enveloped by a cell wall structure. CP has a harder cell wall, which is mainly composed of cellulose, forming a unique cell wall microfibril structure. These microfibrils form a fine mesh structure, which provides conditions for ICG binding. The particle size analysis (Fig. 1C) indicated an average size of 2.23 ± 0.13 μm for CP. Following external modification and loading with ICG, the resulting CP@ICG exhibited a similar regular spherical structure (Fig. 1D, E), with an average size of 2.25 ± 0.15 μm (Fig. 1F). Notably, CP@ICG showed no significant alterations in morphology or size compared to CP. As shown in Fig. 1G, the zeta potentials of CP, ICG, and CP@ICG were measured as -26.13 ± 1.72 mV, -7.21 ± 1.45 mV, and -10.00 ± 0.52 mV, respectively. Due to the relatively low potential of ICG loaded on the surface of CP, which covers a portion of the charges, the Zeta potential of CP@ICG was significantly reduced. To further confirm the successful synthesis of CP@ICG, UV–Visible absorption spectroscopy was performed on the CP@ICG aqueous solution. As shown in Fig. 1H, the absorption curve of CP@ICG exhibits the characteristic absorption peak of ICG at 780 nm. These results collectively affirm the successful loading of ICG. To quantify the concentration of ICG in the CP@ICG, we conducted measurements and constructed a standard curve relating ICG concentration to absorbance, as depicted in Fig. 1I. Through calculations, it was determined that the concentration of ICG in the CP@ICG was 43 μg/mL.
Synthesis and characterization of CP@ICG. A TEM image of CP. B SEM image of CP. C Particle size distribution of CP. D TEM image of CP@ICG. E SEM image of CP@ICG. F Particle size distribution of CP@ICG. G Zeta potentials of CP, ICG, and CP@ICG. H UV–visible absorption spectra of CP, ICG, and CP@ICG. I Standard curve of ICG concentration vs. absorbance
Phototaxis and Hypoxia Tropism of CP@ICG
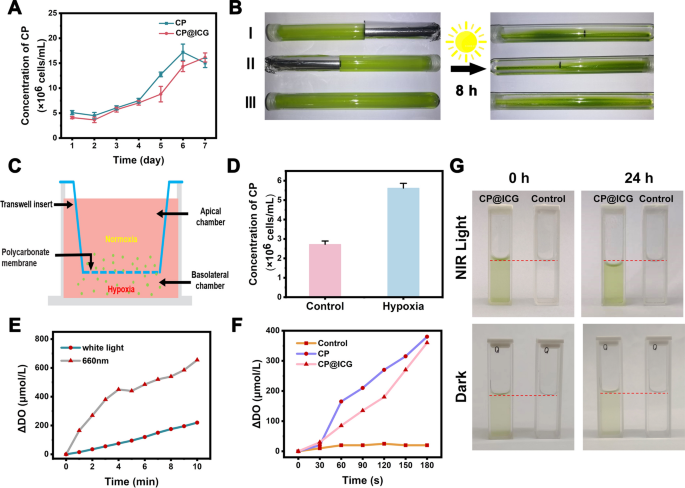
Maintaining the physiological activity of CP is a prerequisite for achieving tumor targeting and treatment with CP@ICG. Therefore, we conducted a one-week growth kinetic monitoring. As shown in Fig. 2A, CP@ICG exhibited a growth trend similar to CP, indicating that its biological activity was not affected by the presence of ICG. This result ensures the functional integrity of CP@ICG for subsequent treatments.
Tropism and Photosynthetic Oxygen Evolution. A Proliferation of CP and CP@ICG under 660 nm NIR light irradiation. B Phototactic characterization of CP. C Schematic representation of CP’s hypoxia tropism characterized by Transwell experiment. D Concentration of CP under hypoxic conditions in the Transwell experiment. E Oxygen evolution of CP@ICG under white light and 660 nm NIR light irradiation. F Comparison of oxygen evolution between CP and CP@ICG under 660 nm NIR light irradiation. G Water decomposition effect of CP@ICG and Control group (ultrapure water) under 660 nm NIR light irradiation or dark condition
The phototactic behavior of CP@ICG was examined by allowing CP@ICG to undergo static cultivation in glass test tubes, with some of the test tubes being partially shaded. As depicted in Fig. 2B, after 8 h of static light incubation, due to gravity, most of the CP@ICG was found to be settled at the bottom of the test tube. In comparison to the shaded portion, it was observed that the solution in the unshaded area appeared to be a deeper shade of green, indicating a higher concentration of CP in that region. This phenomenon was attributed to two contributing factors: on one hand, owing to the abundant chlorophyll content in CP, it could efficiently engage in photosynthesis, thereby providing itself with ample organic substances and energy. Consequently, CP tended to thrive in environments with abundant light, displaying positive phototaxis. On the other hand, sufficient light stimulation promoted the photosynthetic autotrophic reproduction of CP, leading to an increase in concentration and a deepening of the solution’s green color. To further confirm that the concentration variation of CP in test tubes I and II was not solely due to light-induced proliferation, but also related to its phototactic behavior, the test tube without any shading (No. III) was used as a control group. In comparison to the color of the solution in the control group test tube, it was observed that the unshaded areas in test tubes I and II exhibited a deeper color, indicating a higher concentration of CP. Taken together, these results confirmed the strong phototactic behavior of CP@ICG.
Furthermore, the hypoxia tropism of CP@ICG was assessed through a Transwell experiment, as depicted in Fig. 2C. CP@ICG was introduced into the upper chamber, which was maintained under normoxic conditions, while the lower chamber was subjected to hypoxic conditions. Following a static incubation period of 40 min, it was observed that the concentration of CP@ICG in the lower chamber exceeded that in the upper chamber (Fig. 2D). This observation substantiates the hypoxia tropism of CP@ICG, thereby facilitating its responsive accumulation in the hypoxic tumor microenvironment in vivo [24].
Photosynthetic oxygen production and water splitting performance of CP@ICG
Under illuminated conditions, CP, as an efficient photosynthetic microorganism, can utilize Photosystem II (PSII) to cleave water into protons and electrons, subsequently releasing oxygen [25]. As shown in Fig. 2E, compared to white light, CP exhibited enhanced photosynthetic oxygen production under 0.5 W 660 nm NIR light exposure. The oxygen production rate reached 655 μmol/L in 10 min, approximately three times higher than that under white light conditions. Additionally, CP@ICG demonstrated robust photosynthetic oxygen production capability (Fig. 2F). After 3 min of exposure to 0.5 W 660 nm near-infrared light, the oxygen production rate reached 360 μmol/L. This result further confirms that the loading of ICG did not adversely affect the photosynthetic activity of CP. Figure 2G demonstrates the effective photosynthetic water-splitting capability of CP@ICG. These findings collectively indicate that CP@ICG can undergo efficient photosynthesis under 0.5 W 660 nm NIR light exposure. On one hand, CP@ICG can decompose excess water within the tumor tissue, thereby reducing interstitial fluid pressure, enhancing local blood perfusion, and facilitating the transportation of more drugs into the tumor. On the other hand, the oxygen released during water decomposition can alleviate the local hypoxic tumor microenvironment, providing an ample oxygen source for ICG-mediated photodynamic therapy.
Singlet oxygen generation ability of CP@ICG
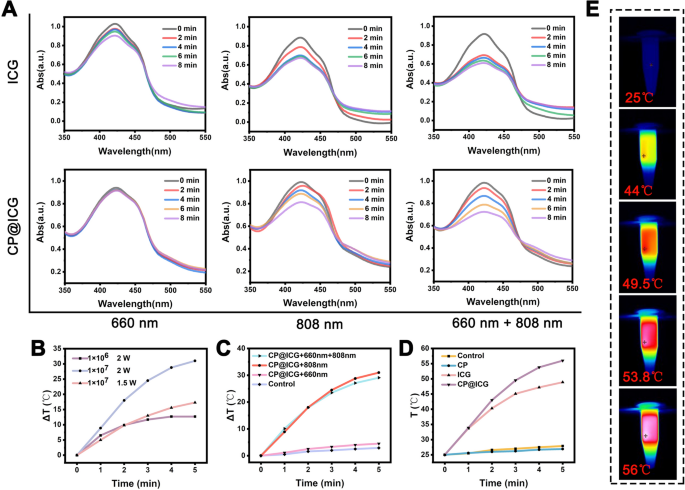
To ascertain the photodynamic therapy (PDT) efficacy of CP@ICG, we employed the DPBF probe to investigate the singlet oxygen generation capabilities of ICG and CP@ICG under varying light irradiation conditions. As illustrated in Fig. 3A, the capacity for active oxygen production by ICG and CP@ICG under 660 nm NIR light stimulation was significantly lower compared to that under 808 nm and 660 nm + 808 nm stimulation. This phenomenon can be attributed to the lower light absorption capacity of ICG at 660 nm in contrast to 808 nm. Additionally, under 660 nm NIR light stimulation, the production of singlet oxygen in CP@ICG was lower compared to ICG. This is attributed to the substantial chlorophyll content in CP, which exhibits a robust absorption capacity for 660 nm NIR light (Fig. 1H). Consequently, this diminishes ICG’s absorption and utilization of light, leading to reduced singlet oxygen generation. Compared with 808 nm irradiation alone, the singlet oxygen generation capacity of CP@ICG was significantly enhanced when 660 nm + 808 nm NIR light was co-stimulated. This is due to the photosynthetic generation of oxygen by chlorophyll in CP under 660 nm NIR light exposure, providing an increased oxygen source for ICG’s photodynamic process, thereby promoting singlet oxygen production. In summary, these results demonstrate that CP@ICG possesses excellent singlet oxygen generation ability, meeting the conditions required for photodynamic therapy. Furthermore, the photosynthetic oxygen production process of CP can further enhance the effectiveness of photodynamic therapy.
The photodynamic and photothermal performance of CP@ICG. A ROS generation of ICG and CP@ICG under different light conditions (660 nm, 808 nm, 660 nm + 808 nm), with DPBF as the ROS detection probe. B Influence of different CP@ICG concentrations and different NIR (808 nm) power densities on photothermal effect. C Influence of different lighting conditions on photothermal effect. D Photothermal effects of different solutions (CP, ICG, CP@ICG) under 808 nm NIR light irradiation. E Thermal images of CP@ICG under 808 nm NIR light irradiation
Photothermal performance of CP@ICG
In addition to serving as a photosensitizer for photodynamic therapy, ICG also exhibits remarkable photothermal conversion performance, efficiently transforming light energy into heat, which can be employed for photothermal therapy of tumors [26]. As shown in Fig. 3B, with increasing concentration and NIR light power, CP@ICG’s heating effect was significantly enhanced. When the concentration of CP@ICG was 1 × 10⁷ cells/mL and the NIR light power is 2 W, the temperature of the CP@ICG solution increased by 31 ℃ after 5 min, fully meeting the requirements for photothermal therapy. Furthermore, the temperature changes in the CP@ICG solution under NIR light irradiation of different wavelengths were investigated. As observed in Fig. 3C, sole irradiation with 660 nm NIR light did not cause a significant change in the temperature of the CP@ICG solution, while 808 nm and 660 nm + 808 nm could notably elevate the solution temperature. The underlying mechanism lies in the capacity of 660 nm NIR light to prompt the transition of ICG molecules from their ground state to an excited state. As these molecules revert back to their ground state, the discharged energy is conveyed to adjacent oxygen molecules. This process culminates in the production of singlet oxygen, ultimately effectuating the desired outcome of photodynamic therapy [27]. In contrast, 808 nm NIR light not only induces photodynamic effects in ICG but also converts the absorbed light energy into heat, thereby realizing photothermal therapy [28].
Figure 3D illustrated the temperature increase in different solutions under 808 nm NIR light irradiation. It was evident from the figure that CP@ICG exhibited the most efficient photothermal effect, surpassing even ICG. This phenomenon was inferred to be attributed to the binding of CP and ICG, which enhanced the system’s absorption of NIR light, consequently increasing the overall photothermal conversion capability. Figure 3E presented the infrared thermographic image of the CP@ICG solution, consistent with the temperature variation curve. All the results corroborated the outstanding photothermal performance of CP@ICG.
Analysis of intracellular ROS production
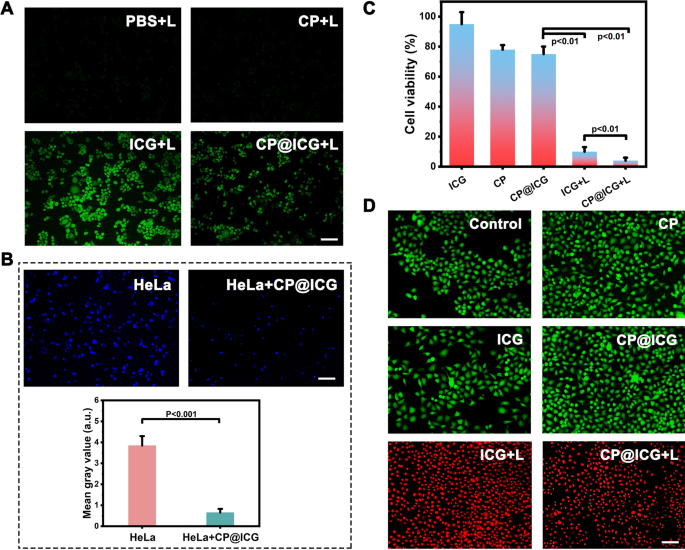
ROS is a byproduct of normal cellular metabolism with an extremely short lifespan, and it exerts no significant toxic effects on cells [29]. However, artificially inducing an excessive production of ROS within cells can lead to apoptosis or even necrosis through oxidative stress reactions [30]. As a photosensitizer, ICG can generate singlet oxygen under NIR light exposure, thus artificially promoting an overload of intracellular ROS. As shown in Fig. 4A, it is evident that both the PBS and CP groups did not exhibit any green fluorescence after exposure to 808 nm laser. In contrast, when co-incubated with HeLa cells and subjected to NIR light, ICG produced a strong green fluorescence signal, indicating the generation of a substantial amount of ROS. The CP@ICG also exhibited a green fluorescence signal after irradiation with 808 nm laser. However, the fluorescence intensity was significantly lower compared to the ICG group. The reason for this was that ICG is loaded onto the surface of CP and binds with CP cells. Due to the larger size of CP cells, they were less likely to be taken up by tumor cells. During the experiment, with the washing steps, ICG was washed away along with the unabsorbed CP, thereby reducing the fluorescence intensity of the solution. Some ICG detached from the surface of CP and was taken up by HeLa cells, resulting in a weaker intracellular green fluorescence.
Cell experiments. A Detection of intracellular ROS production under different treatment conditions using DCFH-DA as a probe. B The effect of CP@ICG on HeLa cell proliferation, with cell nuclei labeled in Hoechst (blue) and quantitatively analyzed using Image J software. C Cell viability under different treatment conditions. D Live/dead cell staining under different treatment conditions, with FDA in green and PI in red. Scale bar: 100 µm. (“L” represents NIR irradiation, 0.5W 660 nm + 2W 808 nm, 5 min)
Anti-tumor effect of CP@ICG In Vitro
Cancer cells primarily rely on aerobic glycolysis to meet their energy and proliferation demands, the process known as the Warburg effect [31]. Targeting this metabolic characteristic, tumor cell energy supply can be disrupted by depleting glucose, thereby inducing tumor cell death [32], which is called starvation therapy. The results in Additional file 1: Fig. S2 demonstrate that the presence of glucose promoted the proliferation of CP. Therefore, CP can serve as a glucose competitor, inhibiting tumor cell growth through starvation therapy. To gain further insights into the impact of Chlorella pyrenoidosa on tumor cell proliferation, CP was co-cultured with HeLa cells, followed by nuclear staining of HeLa cells using the Hoechst nuclear dye. The results were depicted in Fig. 4B. The fluorescence in the co-culture group of HeLa cells with CP was significantly attenuated compared to the group of HeLa cells cultured alone, with hardly any noticeable proliferation observed. Fluorescence quantification analysis using Image J software indicated a substantial disparity in fluorescence intensity between the two groups. The possible reason is that CP consumes nutrients in the environment, especially glucose, during its growth and reproduction. As the main energy source for HeLa cells, the reduction of glucose limits cell activity and proliferation. Therefore, based on the above experimental results, we speculate that CP slows down or inhibits the growth and reproduction of HeLa cells by competing for nutrients, achieving the effect of starvation therapy.
The impact of different treatment modalities on the inhibition of HeLa cell growth was subsequently investigated (Fig. 4C, D). Pure ICG exhibited no pronounced inhibitory effect on HeLa cells. Conversely, both the CP and CP@ICG groups underwent a form of starvation therapy, resulting in a reduction of HeLa cell proliferation without significant induction of apoptosis. As a result, the number of viable cells relative to the control decreased in the CP and CP@ICG groups in Fig. 4C, with no notable apoptosis observed in Fig. 4D for these groups. In contrast, the ICG + L group experienced a substantial decrease in cell viability and a concurrent increase in apoptosis due to the combined effects of PDT and PTT. In comparison to the ICG + L group, the CP@ICG + L group not only amplified the PDT efficacy of ICG through the enhanced oxygenation capability of CP, promoting further ROS generation, but also demonstrated a significant inhibitory effect on HeLa cells under the combined action of PDT, PTT, and starvation therapy.
Anti-tumor effect of CP@ICG in vivo
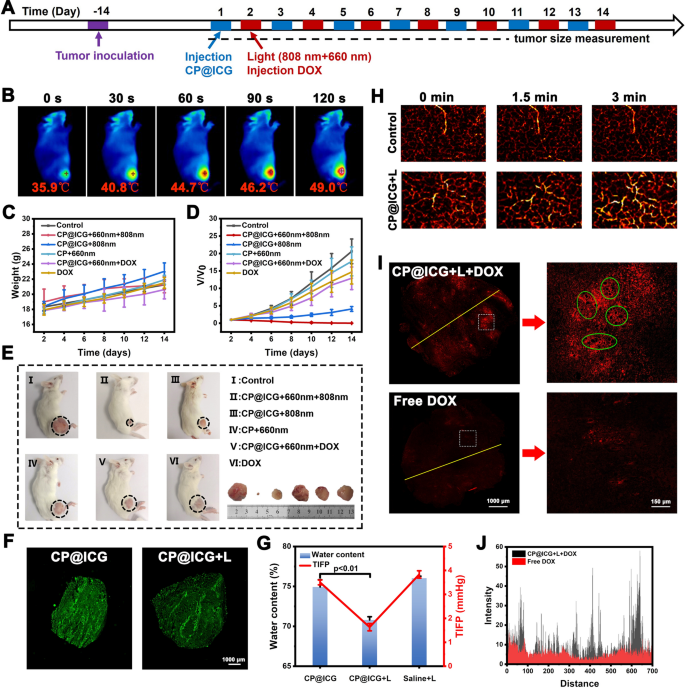
In the in vivo photothermal experiment, CP@ICG demonstrated photothermal performance comparable to that of ICG. To substantiate its ability to maintain photothermal effects in vivo, the temperature variations at the mouse tumor site during 808 nm laser irradiation were captured and recorded using an infrared camera. As shown in Fig. 5B, with the prolonged irradiation time, the local tumor temperature gradually increased, reaching 49.0 ℃, which was 13.1 ℃ higher than the initial temperature. Since tumor cells are less tolerant to heat compared to normal cells, even mild hyperthermia can be effective in sensitizing tumor cells [33, 34]. Therefore, this temperature is sufficient to induce tumor cell death while avoiding harm to normal cells. These results demonstrated that CP@ICG can achieve excellent photothermal therapy effects in vivo. Furthermore, during the treatment period, all groups of mice showed steady weight gain (Fig. 5C), indicating that the administered therapeutic agents did not interfere with the mice’s weight changes, demonstrating good biocompatibility. Figure 5D showed the relative change in tumor volume during the treatment process compared to untreated controls. The control group (saline group) exhibited a consistently rapid growth rate in tumor volume. Compared to the control group, the CP + 660 nm group exhibited a certain inhibitory effect. This can be attributed to the fact that upon reaching the tumor site, CP tends to accumulate in the tumor interstitium due to the rich and viscoelastic nature of tumor cell interstitium. Additionally, CP utilizes nutrients within the tumor site, such as glucose, for its growth and reproduction. This competitive consumption of nutrients within the tumor microenvironment moderately inhibits tumor growth. Thus, the presence of CP demonstrates its role in exerting starvation therapy. The CP@ICG + 808 nm group exhibited a certain level of tumor inhibition. This is attributed to the excellent photothermal effect generated by both CP and ICG under 808 nm laser. Additionally, tumor cells are more heat-sensitive compared to normal cells. Hence, effective eradication and ablation of tumor cells can be achieved through relatively mild photothermal therapy. Of particular note, the CP@ICG + 660 nm + 808 nm group demonstrated the optimal tumor inhibition effect, nearly achieving complete cure. The reason lay in the fact that under 660 nm laser irradiation, CP underwent photosynthesis, leading to the decomposition of water and the generation of oxygen. On one hand, this reduced IFP, thereby enhancing intratumoral drug penetration and delivery efficiency. On the other hand, it alleviated tumor hypoxia, resulting in increased ROS production. Coupled with starvation therapy and photothermal therapy, this ultimately manifested as an outstanding tumor inhibitory effect. In addition, the CP@ICG + 660 nm + DOX treatment group exhibited a superior tumor inhibitory effect compared to the DOX treatment group alone. This could be attributed to the reduction in interstitial fluid pressure (IFP) during treatment, which increased blood perfusion in the tumor site, facilitating drug penetration and enabling a greater amount of DOX to be transported to the tumor site to exert its therapeutic effect. Representative mice and dissected tumor images from each group at the end of the treatment period were shown in Fig. 5E. It was observed that there were differences in tumor growth among the groups after different treatments. The CP@ICG + 660 nm + 808 nm treatment group demonstrated the most significant tumor inhibitory effect, while the tumors in the other groups exhibited varying degrees of growth.
Animal experiments. A Schematic diagrams of animal experiment. B Thermal imaging of tumor-bearing mice injected with CP@ICG under 808 nm NIR irradiation. C Body weight in mice under different treatments. D Tumor volume in mice under different treatments. E Images of tumors in mice from different treatment groups. F Fluorescent tissue section analysis showing the distribution of CP@ICG within the tumor. G Changes in tumor tissue water content and tumor interstitial fluid pressure (TIFP) with or without NIR irradiation after intravenous injection of CP@ICG. H Photoacoustic imaging of the tumor site after CP@ICG + L treatment, reflecting blood perfusion. I Fluorescent tissue section analysis showing the penetration of DOX within the tumor, with significant “hollowing” observed in the enlarged image (green circle). J Distribution of fluorescence intensity in the fluorescent tissue section (yellow line)
Figure 5F illustrated the distribution of CP in tumors for both the CP@ICG group and CP@ICG + L (CP@ICG + 660 nm) group. As shown in the images, both tumor slices exhibited significant fluorescence signals. This outcome affirmed the excellent tumor targeting and deep penetration capabilities of the drug delivery system based on CP. This property was well validated in Fig. 2D, highlighting CP’s tropism for hypoxic environments. Early studies demonstrates that due to their rapid growth, tumors exhibit irregular vascular structures, resulting in a radially hypoxic state within the tumor. As the depth of the tumor increases, the oxygen content gradually decreases [35]. Therefore, the CP-based drug delivery system capitalizes on the hypoxia tropism of CP to navigate towards the hypoxic regions within the tumor, thereby facilitating penetration and drug delivery into the deeper layers of the tumor.
In order to investigate the water depletion effect of CP@ICG in vivo, the tumor water content was assessed across different treatment groups. As shown in Fig. 5G a significant reduction in tumor water content was observed in the group treated with 660 nm NIR light compared to the untreated group. This substantiates the occurrence of photosynthesis by CP@ICG under 660 nm irradiation, thereby depleting local tumor moisture. Our earlier studies have indicated that this reduction in water content leads to a decrease in IFP within the tumor [9, 10, 36]. The results in Fig. 5G similarly confirmed the above theory. After 660 nm NIR light irradiation, a noticeable reduction in IFP was observed, consistent with the change in tumor water content, demonstrating that a reduction in water can lower IFP, thereby increasing local tumor blood perfusion and promoting drug penetration into the tumor. In Fig. 5H, the photoacoustic images depicted the changes in local tumor blood perfusion over time. In the Control group, there was no significant alteration observed in the hemoglobin signal under 660 nm laser irradiation. In contrast, the hemoglobin signal in the CP@ICG group gradually intensified with the prolonged duration of laser irradiation, indicating an augmented blood perfusion. The results indicated that, following stimulation by 660 nm NIR light, CP@ICG facilitated local tumor blood perfusion by reducing IFP through its water-depleting effect.
In Fig. 5I, J it was demonstrated that the treatment with CP@ICG + L significantly enhanced the accumulation of chemotherapy drug DOX at the tumor site. Compared to free DOX, the tumor’s internal drug fluorescence intensity notably increased in the CP@ICG + L + DOX group, affirming the effective enhancement of DOX accumulation and deep penetration within the tumor due to the prior treatment with CP@ICG + L. It’s worth noting that in the localized magnification from Fig. 5I a substantial number of “hollowing” (highlighted in green circles) were clearly observed within the tumor tissue. It is speculated that this phenomenon may be attributed to the gas generated during the photosynthesis-induced water depletion process by the CP, leading to a localized “aerating” effect. The appearance of these cavities also provided excellent pathways for blood perfusion and deep drug penetration.
Biological safety assessment
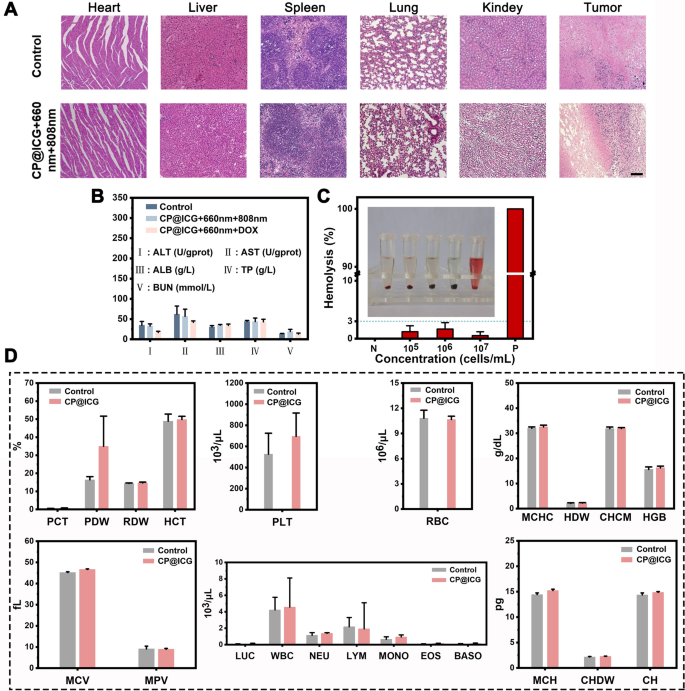
The results of hematoxylin and eosin (HE) staining are presented in Fig. 6A. Slices of heart, liver, spleen, lung, and kidney from the CP@ICG + 660 nm + 808 nm treatment group showed no significant differences compared to the control group, and both groups did not exhibit apparent damage. However, notable differences were observed in the tumor HE-stained sections between the two groups. Compared to the undamaged control group, clear traces of tissue damage were evident in the CP@ICG + 660 nm + 808 nm treatment group. This outcome substantiates that the CP@ICG + 660 nm + 808 nm treatment approach effectively eliminates tumor cells while safeguarding normal tissue, demonstrating good biocompatibility. The kidneys and liver are two vital organs in the body. In order to further assess the biocompatibility of CP@ICG, various liver and kidney indicators were examined in mice. The results of the tests for alanine aminotransferase (ALT), aspartate aminotransferase (AST), albumin (ALB), total protein (TP), and blood urea nitrogen (BUN) are presented in Fig. 6B. Using the values of healthy mice as a reference, it was observed that there were no significant differences in these five indicators between the CP@ICG + 660 nm + 808 nm and CP@ICG + 660 nm + DOX treatment groups and the healthy control group. This suggests that the treatment approach exerted no substantial toxicity or damage to the liver and kidneys.
Figure 6C presents the results of the hemolysis assay. CP@ICG was tested at three concentration gradients: 1 × 10⁵, 1 × 10⁶, and 1 × 10⁷ cells/mL. The positive control group exhibited a vivid red color in the solution, indicating a significant degree of red blood cell hemolysis. In contrast, the supernatant of the negative control group and other experimental groups remained clear, with only faint traces of red. To calculate hemolysis rate accurately, absorbance measurements were taken from the supernatant. The results of hemolysis rate calculations showed that the maximum hemolysis rate in the experimental groups was less than 3%. This indicates that as the concentration of CP@ICG increased, hemolysis did not occur. These results demonstrate that CP@ICG does not induce hemolysis.
In addition, due to the microorganism CP present in the synthesized system CP@ICG, it was imperative to conduct a hematological examination to ascertain whether the therapeutic agent had any impact on the overall health of the mice. Thus, we assessed twenty-two hematological parameters, encompassing the red blood cell system, white blood cell system, and platelet system. As shown in Fig. 6D, there were no significant differences observed in any of the parameters between the drug-injected group and the blank control group, confirming that CP@ICG had no effect on the blood parameters, indicating its excellent biosafety.


