
How Significant Is The Global Solar Energy Boom? (Original Charts)
Sign up for daily news updates from CleanTechnica on email. Or follow us on Google News!
RenewEconomy is a well-established Australian website focusing on green energy. Last week, they published an article by Andrew Blakers based around the claim that “New solar capacity is being installed faster than anything else in history.”
This received some pushback online (“disinformation!”), on the grounds that:
(i) this is only electricity, not total energy; and
(ii) nature doesn’t care how fast something is installed, only about emissions.
We were directed to look at this graph from Our World in Data:
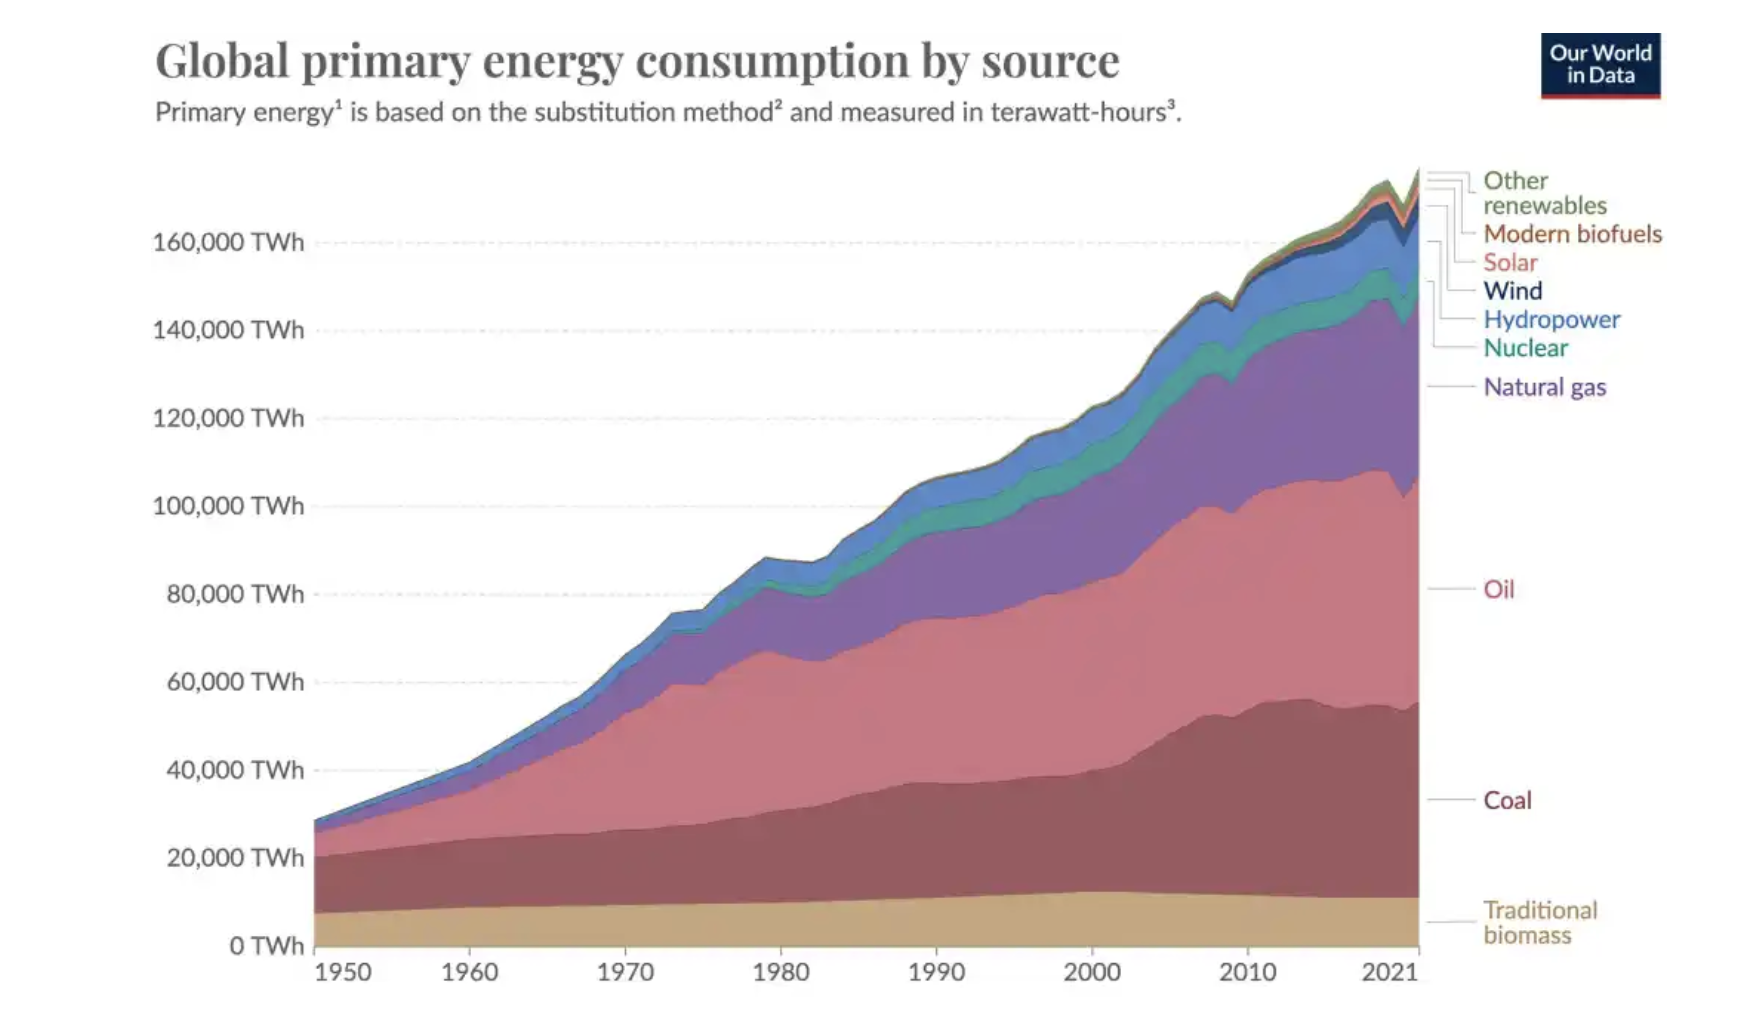
It’s true that solar forms a minute part (2%) of the energy supply as yet, and that emissions of no single fossil fuel have peaked, not even coal.
But the topic at hand is change, and for that we have to look a bit closer.
The low-emission transition is based on two main things:
(i) decarbonising electricity; and
(ii) switching all other energy uses to electricity (“electrify everything”).
You could add more items, such as using less energy in the first place, but that wouldn’t prevent the need for (i) and (ii).
Andrew Blakers is Emeritus Professor of Renewable Energy at the Australian National University, well-known for his work on 100% renewable energy futures and his contribution to the development of solar PV technology. I would be surprised if he had messed anything up.
On the surface, the claim passes easily: 360 GW (gigawatts) of solar PV were installed in 2023 (the IEA says even more, 510 GW), and the fastest period of coal installation that I can find is 75 GW per year, in the mid 2000s.
But it’s more instructive to look at electricity generation, rather than just installed capacity. Solar has a particularly low capacity factor — it generates less when it’s cloudy, and not at all at night time. It’s also at risk of going unused when too much is generated at the same time.
To look at this, I have carried out the following steps:
- I downloaded data on world electricity generation from ember.org.
- As generation fluctuates a lot from year to year, I smoothed the data to reveal the underlying trend.
- I computed the change in generation from each year to the next.
Steps 1 and 2 give the following results for the 6 main sources of electricity:

Solar is the smallest of the six, and the fossil sources are still growing.
Step 3 gives the following results for the growth rate of each source of electricity:

Coal’s rate of growth peaked at 300 TWh (terawatt-hours) per year in 2005 (the rise of China). It then declined until 2019 before accelerating again. Some of that is offset by a slowdown in gas. But, still, the combined slowdown of coal and gas stopped in 2020, which is alarming.
Solar added nearly 300 TWh in 2023, more than any other source, and pretty much matching coal’s old record. Actually, the 2023 data from Ember is provisional — if the IEA’s estimate is correct, the increase could be 400 TWh.
My conclusion is that the original headline (“solar is being installed faster than any technology history”) may be a bit breathless and lacking context, but the underlying trend is clear, and the record is significant. 2023 really was off the charts, and more is yet to come. Solar power generation is increasing as fast as any kind of electricity has ever done. This has been done despite many regions placing no restrictions on fossil fuels at all, and the global average carbon price being just US$5/tonne.
Imagine what we could do if we really tried.
By Robert McLachlan, Massey University, New Zealand
Have a tip for CleanTechnica? Want to advertise? Want to suggest a guest for our CleanTech Talk podcast? Contact us here.
Latest CleanTechnica.TV Video

CleanTechnica uses affiliate links. See our policy here.