
How to Create Mind Maps Using ChatGPT
Introduction
In the field of data science, how you present the data is perhaps more important than data collection and analysis. Data scientists often find it difficult to clearly communicate all of their analytical findings to stakeholders of different levels. This is where data visualization techniques such as flowcharts and mind maps come to help. They make cluttered data and complex ideas more organized and easy to understand. Now, there are a plethora of data visualization tools out there that’ll help you create these. But did you know you can easily get them made using ChatGPT? In this article, I will tell you how to create mind maps using the right prompts on ChatGPT.

What is the Difference Between a Flowchart and a Mind Map?
A flowchart shows the flow of information and has a beginning and an end. Here in this image, we are starting it from two ends. The first is from the Qualifier 1 gate and the second is the Eliminator gate. The chart flows towards the end goal, which is the final win. What you see below is the flowchart of the IPL (Indian Premier League) playoffs.

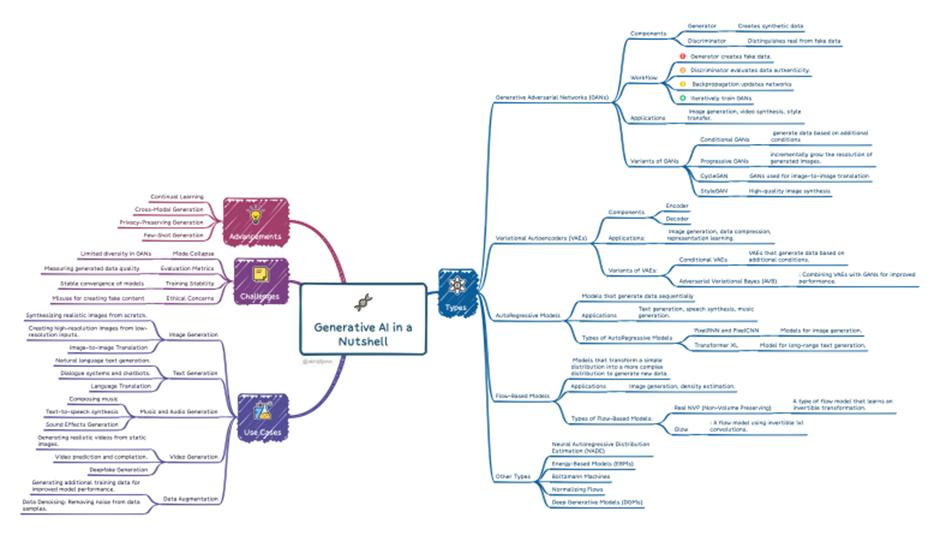
A mind map, although looking like a fancy way to design a flowchart, is more than that. A mind map shows information in clusters (similar to a cluster diagram) and all endpoints link back to one main idea. The image attached below shows a mind map of Generative AI.
Creating Mind Maps Using ChatGPT
Here’s a detailed guide on how to create mind maps using ChatGPT. It’s a simple 3-step process and works for all kinds of topics and applications. So let’s fire up the ChatGPT window and start writing the prompt!
- Write the Right Prompt
Prompt: Create a mind map from the following content. Include relevant topics, tools, and methodologies to clearly show the key points. Please provide a code box with markdown language “Useful Information for Machine Learning Projects… questions about images.”
What I did here was, I just copied and pasted the content from this blog on ‘24 Ultimate Dara Science Projects to Boost Your Knowledge and Skills.’
This is the output generated by ChatGPT for the above prompt:

- Convert the Code to Markdown Format Using Dillinger
Now we have got the Markdown code, but in .txt format. In order to convert the code from .txt format, you have to visit the https://dillinger.io/ website. Just copy and paste the code generated from ChatGPT on the right window. This will generate the converted code on the left window which you can save as a markdown file.

- Convert Your Markdown File to a Mind Map
Now for the final step, go to https://markmap.js.org/repl and copy-paste the code from the Markdown file onto the left window. As soon as you paste the code, the mind map for the same appears on the right side of the window.

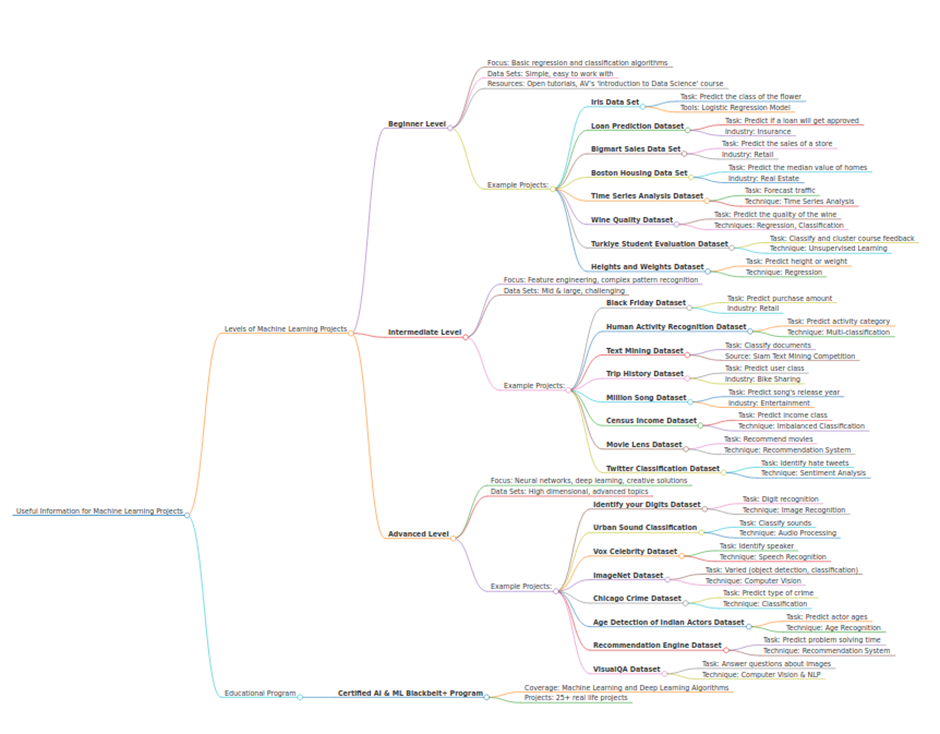
Here’s a full-size image of the mind map we just created using ChatGPT.
Conclusion
ChatGPT offers a seamless and easy way to create mind maps for data visualization. It is one of the fastest and most efficient ways to organize information, brainstorm ideas, and visualize complex concepts. Following this step-by-step guide, you can harness the power of ChatGPT to structure your thoughts, break down intricate topics, and foster creativity.
Whether you’re a student, professional, or hobbyist, using ChatGPT for mind-mapping and flowcharting can greatly enhance your productivity and clarity of communication. So, dive in, explore the possibilities, and let ChatGPT be your trusted companion in organizing your ideas with precision and ease.