
Proactive vaccination using multiviral Quartet Nanocages to elicit broad anti-coronavirus responses
Plasmids and cloning
Cloning was performed using standard PCR methods with Q5 High-Fidelity 2× Master Mix (New England Biolabs) and Gibson assembly. All open-reading frames were validated by Sanger sequencing (Source Bioscience).
pET28a-SpyCatcher003-mi3 (GenBank MT945417, Addgene 159995) was previously described58. pET28a-SpyTag-MBP (GenBank MQ038699, Addgene 35050) has been published59. pDEST14-SpySwitch (GenBank ON131074, Addgene plasmid ID 184225) was previously described19. Monomeric sarbecovirus RBD expression vectors contained a C-terminal SpyTag003 (RGVPHIVMVDAYKRYK)16 and His8-tag (ref. 12) in the plasmid p3BNC-RBD-His8-SpyTag003 and were previously described19: SARS2 (GenBank ON131086), SARS1 (GenBank ON131087), RaTG13-CoV (GenBank ON131088), SHC014-CoV (GenBank ON131089), Rs4081-CoV (GenBank ON131090), pangolin17 (pang17)-CoV (GenBank ON131091), RmYN02-CoV (GenBank ON131092), Rf1-CoV (GenBank ON131093), WIV1-CoV (GenBank ON131094), Yunnan2011 (Yun11)-CoV (GenBank ON131095), BM-4831-CoV (GenBank ON131096) and BtKY72-CoV (GenBank ON131097). The origins of the sarbecovirus RBDs are SARS1 (GenBank AAP13441.1; residues 318–510), WIV1 (GenBank KF367457; residues 307–528), SHC014 (GenBank KC881005; residues 307–524), BM-4831 (GenBank NC014470; residues 310–530), BtKY72 (GenBank KY352407; residues 309–530), pang17 (GenBank QIA48632; residues 317–539), SARS2 (GenBank NC045512; S protein residues 331–529), RaTG13 (GenBank QHR63300; S protein residues 319–541), Rs4081 (GenBank KY417143; S protein residues 310–515), RmYN02 (GSAID EPI_ISL_412977; residues 298–503) and Rf1 (GenBank DQ412042; residues 310–515). The monomeric SARS2 VOC RBDs for Supplementary Fig. 18 ELISAs were cloned into pcDNA3.1 with the influenza H7 hemagglutinin (A/HongKong/125/2017) signal peptide followed by a SpyTag followed by the RBD: Wuhan (GenBank MT945427.1, Addgene 159999), Delta (GenBank PP136028, Addgene plasmid ID 214723), BQ.1.1 (GenBank PP136030, Addgene plasmid ID 214725) and XBB.1.5 (GenBank PP136029, Addgene plasmid ID 214724). The SARS2 Wuhan Spike protein was the HexaPro variant (a gift from Jason McLellan, Addgene plasmid ID 154754) that contains six proline substitutions (F817P, A892P, A899P, A942P, K986P, V987P) which confer greater stability60. The SARS2 Beta variant Spike protein was cloned from HexaPro to match the B.1.351 variant (L18F, D80A, D215G, ∆242-244, R246I, K417N, E484K, N501Y, D614G, A701V) in addition to the previously outlined six proline mutations. The SARS2 Delta variant Spike protein was cloned from HexaPro to match the B.1.617.2 variant (T19R, T95I, G142D, ∆156-157, R158G, L452R, T478K, D614G, P681R, D950N) in addition to the previously outlined six proline mutations.
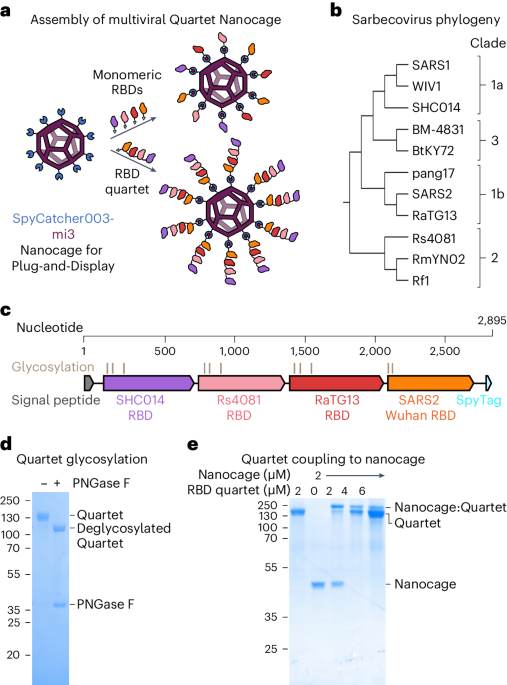
Quartet RBD constructs were cloned using Gibson assembly in competent Escherichia coli DH5α cells and began with the influenza H7 hemagglutinin (A/HongKong/125/2017) signal-peptide sequence. Each RBD was separated with an eight or nine residue Gly-Ser linker. Each linker was distinct from all others in the construct to reduce potential recombination and facilitate sequence analysis. pcDNA3.1-Quartet-SpyTag was created by cloning from the N terminus to C-terminal SHC014 RBD, Rs4081 RBD, RaTG13 RBD and SARS2 RBD with a C-terminal SpyTag into pcDNA3.1 (Fig. 1c; GenBank PP136033, Addgene plasmid ID 214726). This is the construct used for Figs. 1 and 2. For subsequent figures, pcDNA3.1-SpyTag-Quartet was cloned with a SpyTag after the signal sequence and then the same order of RBDs (SpyTag-SHC014-Rs4081-RaTG13-SARS2) (Supplementary Fig. 8; GenBank PP136031, Addgene Plasmid ID 214727). pcDNA3.1-Quartet [SARS1] was cloned with SpyTag after the signal sequence, with SARS1 in the position of SARS2 (SpyTag-SHC014-Rs4081-RaTG13-SARS1) (Supplementary Fig. 8; GenBank PP136034, Addgene plasmid ID 214729). pcDNA3.1-Alternate Quartet was cloned with SpyTag after the signal sequence, followed by pang17 RBD, RmYN02 RBD, Rf1 RBD and WIV1 RBD (Supplementary Fig. 8; GenBank PP136032, Addgene plasmid ID 214728). pcDNA3.1-SpyTag-Quartet_NoLinker was cloned with the same order of RBDs as SpyTag-Quartet (SpyTag-SHC014-Rs4081-RaTG13-SARS2) but did not have any Gly-Ser linker between RBDs (Supplementary Fig. 8; GenBank PP136036, Addgene plasmid ID 214731). pcDNA3.1-Kraken Quartet was identical to SpyTag-Quartet with the SARS2 XBB.1.5 RBD in place of SARS2 Wuhan RBD (Supplementary Fig. 8; GenBank PP136035, Addgene plasmid ID 214730).
Bacterial expression
pET28a-SpyCatcher003-mi3 or pET28a-SpyTag-MBP was transformed into E. coli BL21(DE3) cells (Agilent) and grown on LB-Agar plates with 50 μg ml−1 kanamycin for 16 h at 37 °C. A single colony was added in 10 ml of LB medium containing 50 μg ml−1 kanamycin and grown for 16 h at 37 °C with shaking at 200 rpm. This starter culture was then added to 1 l of LB containing 50 μg ml−1 kanamycin and incubated at 37 °C and with 200 rpm shaking until optical density (OD)600 0.6. Cultures were induced with 0.5 mM isopropyl β-d-1-thiogalactopyranoside. For SpyCatcher003-mi3, cells were grown at 22 °C with shaking at 200 rpm for 16 h. For SpyTag-MBP, cells were grown at 30 °C with shaking at 200 rpm for 4 h. Cultures were pelleted by centrifugation at 4,000g.
Purification of SpyCatcher003-mi3
Cell pellets were resuspended in 20 ml of 20 mM Tris-HCl, 300 mM NaCl, pH 8.5, supplemented with 0.1 mg ml−1 lysozyme, 1 mg ml−1 cOmplete mini EDTA-free protease inhibitor (Roche) and 1 mM phenylmethanesulfonyl fluoride. The lysate was incubated at 4 °C for 45 min with end-over-end mixing. An Ultrasonic Processor equipped with a microtip (Cole-Parmer) was used to perform sonication on ice (four times for 60 s, 50% duty-cycle). Centrifugation at 35,000g for 45 min at 4 °C was used to clear cell debris. Then, 170 mg of ammonium sulfate was added per ml of lysate and incubated at 4 °C for 1 h, while mixing at 120 rpm, to precipitate the particles. The solution was centrifuged for 30 min at 30,000g at 4 °C. The pellet was resuspended in 10 ml of mi3 buffer (25 mM Tris-HCl, 150 mM NaCl, pH 8.0) at 4 °C and filtered sequentially through 0.45 µm and 0.22 µm syringe filters (Starlab). The filtrate was dialysed for 16 h against 1,000-fold excess mi3 buffer. The dialysed particles were centrifuged at 17,000g for 30 min at 4 °C and filtered through a 0.22-µm syringe filter. The purified SpyCatcher003-mi3 was loaded onto a HiPrep Sephacryl S-400 HR 16-60 column (GE Healthcare), which was equilibrated with mi3 buffer using an ÄKTA Pure 25 system (GE Healthcare). The proteins were separated at 0.1 ml min−1 while collecting 1 ml of elution factions. The fractions containing the purified particles were pooled and concentrated using a Vivaspin 20 100 kDa molecular weight cut-off centrifugal concentrator (GE Healthcare) and stored at −80 °C.
Mammalian protein expression
Mammalian expression of all RBD and Spike constructs was performed in Expi293F cells (Thermo Fisher, A14635). Expi293F cells were grown under humidified conditions at 37 °C and 8% (v/v) CO2 in Expi293 Expression Medium (Thermo Fisher) with 50 U ml−1 penicillin and 50 µg ml−1 streptomycin. Transfections were performed using the ExpiFectamine 293 Transfection Kit (Thermo Fisher). Expi293F cells were brought to 3 × 10⁶ cells per ml and then 1 μg of plasmid DNA per ml of culture was incubated with ExpiFectamine 293 reagent for 20 min, before being added dropwise to the Expi293F culture. After approximately 20 h, ExpiFectamine 293 Transfection Enhancers 1 and 2 were added. Cell supernatants were collected after 5 d by centrifuging for 4,000g at 4 °C for 5 min and were passed through a 0.45 μm filter and then a 0.22 μm filter (Starlab).
SpySwitch purification
RBDs, Quartets and SpyTag-MBP were purified by SpySwitch19. Purifications were performed at 4 °C. For SpyTag-MBP, cells were lysed according to the same procedure as SpyCatcher003-mi3 and supplemented with 10× SpySwitch buffer (500 mM Tris-HCl, pH 7.5, +3 M NaCl) 10% (v/v). For mammalian proteins, 10× SpySwitch buffer was added to mammalian culture supernatant at 10% (v/v). SpySwitch resin19, packed in an Econo-Pac Chromatography Column (Bio-Rad), was pre-equilibrated with 2 × 10 column volumes (CV) of SpySwitch buffer (50 mM Tris-HCl, pH 7.5, +300 mM NaCl). The supernatant was incubated with SpySwitch resin for 1 h at 4 °C on an end-over-end rotator. The column was washed twice with 15 CV of SpySwitch buffer. Proteins were eluted using a weakly acidic pH switch. The protein was incubated with 1.5 CV of SpySwitch Elution Buffer (50 mM acetic acid/sodium acetate, pH 5.0, +150 mM NaCl) at 4 °C with the column capped. The cap was removed and the elution flow-through was collected into a microcentrifuge tube containing 0.3 CV of 1 M Tris-HCl pH 8.0. The microcentrifuge tube was mixed by inversion to minimize the time spent at an acidic pH. This elution step was repeated for a total of six times. Purification was assessed by SDS–PAGE with Coomassie staining. Briefly, 10 µl volumes of fractions were mixed with 2 µl of 6× SDS loading buffer (234 mM Tris-HCl pH 6.8, 24% (v/v) glycerol, 120 μM bromophenol blue, 234 mM SDS), before heating at 95 °C for 5 min in a C1000 Touch Thermal Cycler (Bio-Rad) and loading onto 12% SDS–PAGE, then staining with Coomassie. Typical yields for the RBD Quartets were 50–100 mg per litre of culture. Typical yields for RBD monomers were 80–160 mg per litre of culture, as measured by bicinchoninic acid. Elution fractions were dialysed for 16 h against 1,000-fold excess Tris-buffered saline (TBS) (50 mM Tris-HCl, 150 mM NaCl, pH 7.4 at 25 °C). Proteins were stored in aliquots at −80 °C.
Ni-NTA purification
SARS2 Spike proteins were purified by nickel-nitrilotriacetic acid (Ni-NTA) affinity chromatography. Mammalian supernatants were supplemented with 10× Ni-NTA buffer (500 mM Tris-HCl, 3 M NaCl, pH 7.8) at 10% (v/v). Ni-NTA agarose (Qiagen) was packed in an Econo-Pac Chromatography Column (Bio-Rad) and washed with 2 × 10 CV of Ni-NTA buffer (50 mM Tris-HCl, 300 mM NaCl, pH 7.8). Mammalian supernatant was incubated in the Ni-NTA column for 1 h at 4 °C with rolling. The supernatant was allowed to flow through by gravity, before being washed with 2 × 10 CV of Ni-NTA wash buffer (10 mM imidazole in Ni-NTA buffer). Elutions were performed by incubating resin with Ni-NTA elution buffer (200 mM imidazole in Ni-NTA buffer) for 5 min, before eluting by gravity. A total of six 1-CV elutions were performed. Elution fractions were assessed by SDS–PAGE with Coomassie staining, pooled and dialysed for 16 h against 1,000-fold excess TBS.
Size-exclusion chromatography
Quartets were loaded onto a HiPrep Sephacryl S-200 HR 16-600 column (GE Healthcare), which was equilibrated with PBS pH 7.4 and run with an ÄKTA Pure 25 system (GE Healthcare). The proteins were separated at 0.5 ml min−1 while collecting 1 ml of elution factions. A Gel Filtration Standard (Bio-Rad) was run over the column under the same conditions for comparison. All size-exclusion chromatography was performed at 4 °C.
PNGase F digestion
Quartet protein (2 µg) was incubated with 1 µl of Glycoprotein Denaturing Buffer (10×) (New England Biolabs) at 100 °C for 10 min with a C1000 Touch Thermal Cycler (Bio-Rad). The denatured protein was then chilled on ice for 1 min and centrifuged for 10 s at 2,000g with a MiniStar Silverline (VWR). Then 2 µl of GlycoBuffer 2 (10×) (New England Biolabs), 2 µl of 10% (v/v) NP-40, 6 µl of MilliQ water and 1 µl of PNGase F (New England Biolabs) at 500,000 units per ml were added and incubated at 37 °C for 1 h. Proteins were resolved on 12% SDS–PAGE, stained with Coomassie and imaged using a ChemiDoc XRS imager.
DLS
First, 2 µM SpyTag antigens were conjugated with 2 µM SpyCatcher003-mi3 for 48 h at 4 °C. Proteins were centrifuged for 30 min at 16,900g at 4 °C and 30 µl of the supernatant was loaded into a quartz cuvette. Samples were measured at 20 °C using a Viscotek 802 (Viscotek) with 20 scans of 10 s each, using 50% laser intensity, 15% maximum baseline drift and 20% spike tolerance. Before collecting data, the cuvette was incubated in the instrument for 5 min to allow the sample temperature to stabilize. The intensity of the size distribution was normalized to the peak value using OmniSIZE v.3.0 software, calculating the mean and standard deviation from the multiple scans (Viscotek).
Negative-stain TEM
First, 2 μM SpyCatcher003-mi3 was incubated for 48 h at 4 °C with 2 μM of the appropriate antigens to make Homotypic SARS2 Nanocage, Mosaic-8 and Quartet Nanocage or without any antigen present in 25 mM Tris-HCl, 150 mM NaCl, pH 8.0. Samples were applied to a freshly glow-discharged TEM grid, blotted twice with water and stained with 2% (w/v) uranyl acetate for 30 s. Samples were imaged using a Tecnai G2 80–200-keV transmission electron microscope at the Cambridge Advanced Imaging Centre. For size analysis, the particle diameter for each group was measured manually (n = 75) and plotted with 2-nm bin size in Excel (Microsoft).
Endotoxin depletion and quantification
Endotoxin was removed from all vaccine components using Triton X-114 phase separation61,62. Triton X-114 at a final 1% (v/v) was added to the protein on ice and incubated for 5 min. The solution was incubated at 37 °C for 5 min and centrifuged for 1 min at 16,000g at 37 °C. The top phase was transferred to a fresh tube. This procedure was repeated for a total of three times. A final repetition without the addition of Triton X-114 was performed, to account for residual Triton X-114. A Pierce Chromogenic Endotoxin Quant Kit (Thermo Fisher) was used according to manufacturer instructions to quantify the final endotoxin concentration. All vaccine components were below the accepted endotoxin levels for vaccine products of 20 endotoxin units per ml (ref. 63).
Immunogen preparation
The concentration of vaccine components was measured using bicinchoninic acid assay (Pierce). Where multiple antigens were coupled to the nanocage, the antigens were first mixed in equimolar amounts in TBS. Doses were normalized by the number of SpyTags, to facilitate an equimolar amount of SpyCatcher003-mi3 nanocages with similar occupancy in each condition. For high-dose immunizations (Supplementary Figs. 14–16), SpyCatcher003-mi3 at 8 µM was incubated with 8 µM SpyTagged antigen for 48 h at 4 °C in TBS, pH 8.0. For other immunizations, SpyCatcher003-mi3 at 0.8 µM was incubated with 0.8 µM total SpyTagged antigen for 48 h at 4 °C in TBS, pH 8.0. Uncoupled RBD and Uncoupled Quartet were incubated at 0.8 µM for 48 h at 4 °C in TBS, pH 8.0, without the addition of SpyCatcher003-mi3. Before immunization, samples were analysed by SDS–PAGE/Coomassie and DLS. For Fig. 5, SARS2 Spike prime and boost doses were performed with 10 µg of SARS2 Wuhan Spike (HexaPro) protein in TBS pH 8.0 at 4 °C.
Mouse immunization and blood sampling
Animal experiments were performed according to the UK Animals (Scientific Procedures) Act 1986, under Project License (PBA43A2E4 and PP9362617) and approved by the University of Oxford Animal Welfare and Ethical Review Body. Mice that were 6 weeks old (at the time of the first immunization) were obtained from Envigo. For high-dose immunizations (Supplementary Figs. 14–16), we used BALB/c female mice, and for all other immunizations we used C57BL/6 female mice. Mice were housed in accordance with the UK Home Office ethical and welfare guidelines and fed on standard chow and water ad libitum. Before immunization, immunogens were mixed 1:1 with VAC 20 adjuvant (SPI Pharma) (25 µl + 25 µl), except for the high-dose immunizations (Supplementary Figs. 14–16) where immunogens were mixed 1:1 with AddaVax (Invivogen). This procedure gave final doses of 0.2 nmol of total SpyTagged antigen for high-dose immunizations and 0.02 nmol of total SpyTagged antigen for normal-dose immunization. For normal-dose immunization, this relates to 0.6 µg of Uncoupled RBD. Isoflurane (Abbott)-anaesthetised mice were immunized on day 0 and day 14 intramuscularly in the gastrocnemius muscle with the specified antigen–adjuvant mix. Post-prime blood samples were obtained on day 13 via tail vein using Microvette (CB300, Sarstedt) capillary tubes. Post-boost samples were obtained on days 32 to 41 (exact day for each set of immunizations is indicated in the figure) via cardiac puncture of humanely killed mice. The collected whole blood in microtainer SST tubes (Becton Dickinson) was allowed to clot at 25 °C for 1–2 h, before spinning down at 10,000g for 5 min at 25 °C. The sera were heat-inactivated at 56 °C for 30 min, before storing at −20 °C.
Mouse antisera ELISA
Nunc MaxiSorp plates (Thermo Fisher) were coated with 80 nM purified SpyTag-RBD, SpyTag-MBP or SpyCatcher003-mi3 in PBS (137 mM NaCl, 2.7 mM KCl, 10 mM Na2HPO4, 1.7 mM KH2PO4, pH 7.4) at 4 °C for 16 h. Where SARS2 was analysed, this refers to the Wuhan variant, unless indicated. In Supplementary Fig. 5b, the response to different SARS2 variants was measured by coating 1 µg ml−1 of the indicated HexaPro Spike protein in PBS and incubating at 4 °C for 16 h. Plates were washed three times with PBS supplemented with 1% (v/v) Tween 20 (PBST). Plates were blocked by 2 h of incubation at 25 °C with 5% (w/v) skimmed milk in PBS. Plates were then washed three times with PBST. Sera were serially diluted into the blocking buffer using eight-point, fourfold series starting at 1:100. Plates were incubated with sera for 1 h at 25 °C and then washed three times with PBST. Plates were incubated at 25 °C for 1 h with a 1:1,600 dilution of horseradish peroxidase-conjugated goat anti-mouse IgG antibody (Sigma-Aldrich, A9044). Plates were washed three times with PBST. Plates were then incubated at 25 °C for 5 min with 1-Step Ultra TMB-ELISA Substrate Solution (Thermo Scientific) before the reaction was stopped with 1 M H2SO4. Absorbance measurements at 405 nm (A405) were taken with a FLUOstar Omega plate reader (BMG Labtech) using Omega MARS software (BMG Labtech). A sigmoidal dose–response curve was fit to the absorbance data using the optimize.curve_fit() function from the Python SciPy library64. The sigmoidal dose–response function was:
$${{y}}={\rm{Bottom}}+\frac{{\rm{Top}}-{\rm{Bottom}}}{1+{10}^{{\log }_{10}\left({{\rm{IC}}}_{50}\right)-{{x}}}}$$
IC50 is the serum concentration that gives a 50% signal between the maximum and minimum of the curve. The area under the fitted curve was determined using the trapz function from the Python NumPy library65. Area under the curve was used instead of endpoint titre to account better for data across the entire range of values66. For calculation of midpoint titre, sigmoidal dose–response curve absorbance data and the midpoint were calculated using GraphPad Prism (GraphPad Software v.9.4.1). Results were plotted using GraphPad Prism (GraphPad Software v.9.4.1).
Microneutralization assay
These assays were performed in the James & Lillian Martin Centre, University of Oxford, operating under license from the Health and Safety Authority, UK, on the basis of an agreed Code of Practice, Risk Assessments (under the Advisory Committee on Dangerous Pathogens) and standard operating procedures. The microneutralization assay determines the serum concentration that induces a 50% reduction in focus-forming units of SARS2 in Vero cells (American Type Culture Collection, CCL-81). A serial dilution of immunization sera (seven steps from 1/40 to 1/40,000 diluted into DMEM) was pre-incubated for 30 min at 25 °C with a fixed dose of 100–200 focus-forming units (20 μl) of different authentic SARS2 variants. This procedure was performed in triplicate for samples from high-dose immunizations outlined in Supplementary Figs. 14–16 and in quadruplicate for all other samples. DMEM on its own was used for serum-free control wells, which were used to define 100% infectivity. The Victoria 01/2020 isolate (Pango B) was used for Wuhan neutralization67. The Beta variant (Pango B.1.351) used for neutralizations is the HV001 isolate, sequenced and kindly supplied by CAPRISA, Durban, South Africa68. The isolates for Delta (Pango B.1.617.2), Omicron BA.1 (Pango B.1.1.529.1) and Omicron BQ.1.1 (Pango B.1.1.529.5.3.1.1.1.1.1.1) were kindly supplied by Gavin Screaton (University of Oxford). This mixture was incubated with 100 μl of Vero cells (4.5 × 10⁴) at 37 °C with 5% (v/v) CO2. At 2 h into this incubation, a 1.5% (w/v) carboxymethyl cellulose-containing overlay was applied to prevent satellite focus formation. At 18 h post-infection, the monolayers were fixed with 4% (w/v) paraformaldehyde in PBS and then permeabilized with 2% (v/v) Triton X-100. The cells were stained using the FB9B monoclonal antibody at 1 µg ml−1 (ref. 69). These samples were developed using an anti-human IgG (Fc-specific) peroxidase-conjugated antibody (1:5,000 dilution, cat. no. A0170-1ML, Sigma-Aldrich) and True Blue peroxidase substrate. The infectious foci were enumerated by Classic ELISpot Reader (AID GmbH). Data were analysed using four-parameter logistic regression (Hill equation) using GraphPad Prism (GraphPad Software v.8.3). Statistical significance of differences between groups was determined using a one-way analysis of variance (ANOVA) test, followed by Tukey’s multiple comparison post hoc test of half-maximal inhibitory dilution (ID50) values converted to log10 scale using GraphPad Prism (GraphPad Software v.9.4.1).
Pseudovirus neutralization assay
SARS2 BQ.1.1, SARS1, WIV1, SHC014 and BtKY72 K493Y/T498W pseudotyped viruses were prepared as described70,71. The double mutation BtKY72 K493Y/T498W in the BtKY72 Spike protein has previously been shown to enable entry to human cells via ACE2 (ref. 72). This technique for producing pseudoviruses employs HIV-based lentiviral particles with genes encoding the appropriate Spike protein lacking the cytoplasmic tail. A threefold serial dilution of sera was incubated with pseudotyped virus for 1 h at 37 °C. The mixture was incubated with 293TACE2 target cells for 48 h at 37 °C (ref. 12). Cells were washed twice with PBS, before being lysed with Luciferase Cell Culture Lysis 5× reagent (Promega). NanoLuc Luciferase activity in the lysates was measured using the Nano-Glo Luciferase Assay System (Promega). The relative luminescence units were normalized to values derived from cells infected with pseudotyped virus in the absence of serum. ID50 was determined using four-parameter nonlinear regression in AntibodyDatabase73 and plotted using GraphPad Prism (GraphPad Software v.9.4.1). Statistical significance of differences between groups was determined using an ANOVA test, followed by Tukey’s multiple comparison post hoc test of ID50 values converted to log10 scale using GraphPad Prism (GraphPad Software v.9.4.1).
Monoclonal antibody ELISAs
We incubated 2 μM SpyTag-Quartet or 2 μM Quartet-SpyTag with or without 2 μM SpyCatcher003-mi3 in 25 mM Tris-HCl, 150 mM NaCl, pH 8.0, for 16 h at 4 °C to allow for coupling. We added the protein samples at 50 nM to Nunc MaxiSorp plates (Thermo Fisher) and incubated for 16 h at 4 °C in PBS pH 7.4. We then washed three times with PBST and blocked with 5% (w/v) skim milk for 2 h at 25 °C. We washed three times more and incubated with 50 nM of the specified antibody for 1 h at 25 °C. The monoclonal antibodies used in this study, namely C121 71, EY-6A, FI-3A, FP-12A, IY-2A (ref. 45), LCA60 (ref. 74), FP-8A and FD-5D (refs. 19,69), have all been previously described. Heavy and light chain expression vectors for these antibodies were co-transfected into ExpiCHO cells (Thermo Fisher Scientific, A29133) using the ExpiCHO expression system kit, and the monoclonal antibodies were purified from the supernatant by Protein A Sepharose (GE Healthcare). After three washes, we incubated with a 1/2,500 dilution of anti-human IgG horseradish peroxidase (Sigma-Aldrich, A8667) for 1 h at 25 °C. After three washes, we incubated with TMB for 30 s (for comparison of coupled and uncoupled Quartet) or 2 min (for comparison of SpyTag-Quartet and Quartet-SpyTag), before stopping with 1 M HCl. A405 measurements of triplicate wells per condition were taken at 25 °C with a FLUOstar Omega plate reader (BMG Labtech) using Omega MARS software (BMG Labtech).
Deep mutational scanning
Serum mapping studies were performed following the previously established approach26: 25 µl of each serum sample was heat-inactivated for 30 min at 56 °C, before depleting twice by incubation with 50 OD units of AWY101 yeast containing an empty vector, to deplete serum of non-specific yeast-binding antibodies. Yeasts that were generously provided by Tyler Starr (University of Utah) were induced to express the SARS2 RBD library in galactose-containing synthetic defined medium with casamino acids: 6.7 g l−1 Yeast Nitrogen Base, 5.0 g l−1 casamino acids, 1.065 g l−1 2-(N-morpholino)ethanesulfonic acid (MES), 2% (w/v) galactose and 0.1% (w/v) dextrose26. After a 16–18-h induction, cells were washed and incubated with serum at a range of dilutions for 1 h at 25 °C with gentle agitation. For each serum sample, a subsaturating dilution enabled the fluorescent signal from antibody binding to be equivalent across samples. The libraries were washed and labelled for 1 h with 1:100 fluorescein-conjugated anti-myc tag antibody (Immunology Consultants Lab, CYMC-45F) to quantify RBD expression and 1:200 Alexa Fluor-647-goat anti-mouse-IgG Fc-gamma (Jackson ImmunoResearch, 115-605-008) to detect mouse antibodies from serum. Approximately 5 × 10⁶ RBD-positive cells were processed on a Sony SH800 cell sorter. A flow cytometric gate was drawn to capture RBD mutants with reduced antibody binding compared with their level of RBD expression26. These cells were grown overnight, before plasmid extraction in a synthetic defined medium with casamino acids: 6.7 g l−1 Yeast Nitrogen Base, 5.0 g l−1 casamino acids, 1.065 g l−1 MES, 2% (w/v) dextrose, 100 U ml−1 penicillin and 100 µg ml−1 streptomycin. Plasmid samples were then prepared from 30 OD units (1.6 × 10⁸ colony forming units; cfu) of preselection yeast populations and 5 OD units (~3.2 × 10⁷ cfu) of overnight cultures of serum-escaped cells (Zymoprep Yeast Plasmid Miniprep II)26. The 16-nucleotide barcodes identifying each RBD variant were amplified by PCR and sequenced on an Illumina HiSeq 2500 with 50-base pair single-end reads26. We computationally filtered out variants with >1 amino acid mutation, low sequencing counts or highly deleterious mutations that might escape antibody binding because of poor RBD expression or folding26. The escape fraction represents the proportion of cells expressing that specific variant that falls in the escape bin: a value of 0 means that the variant is always bound by serum antibody and a value of 1 means that the variant always escapes serum antibody binding. The height of each letter indicates the escape fraction for that amino acid mutation, calculated as described above. The static logo plots feature any site where, for at least one serum sample, the site-total antibody escape was >10× the median across all sites and at least 10% the maximum of any site. RBD sites are categorized based on antibody epitope region28. Class 1 epitopes are defined as residues 403, 405, 406, 417, 420, 421, 453, 455–460, 473–478, 486, 487, 489, 503 and 504. Class 2 epitopes are defined as residues 472, 479, 483–485 and 490–495. Class 3 epitopes are defined as residues 341, 345, 346, 354–357, 396, 437–452, 466–468, 496, 498–501 and 462. Class 4 epitopes are defined as residues 365–390 and 408.
Bioinformatics
The phylogenetic tree of sarbecovirus RBD sequences was constructed using MEGA X v.11.0.13 software75. Multiple sequence alignment and calculation of amino acid identity were performed using Clustal Omega v.1.2.4 (ref. 76). The structure of SARS2 RBD was based on PDB ID: 6ZER (ref. 77) and analysed using PyMOL v.2.5.2.
Statistics and reproducibility
No statistical method was used to predetermine sample size. Significance for ELISAs was calculated with an ANOVA test using Tukey’s post hoc test in GraphPad Prism (GraphPad Software v.9.4.1). Comparisons for neutralizations were calculated with an ANOVA test, followed by Tukey’s multiple comparison post hoc test of ID50 values converted to log10 scale using GraphPad Prism (GraphPad Software v.9.4.1). For ELISAs and neutralizations, Tukey’s test was used to correct for the multiple comparisons between the responses raised to each individual antigen within each set of immunizations. Significance was assigned according to: *P < 0.05, **P < 0.01, ***P < 0.001. On graphs where some conditions are compared, where no test is marked then the difference was non-significant. The experiments were not randomized. The investigators were not blinded to allocation during experiments and outcome assessment.
Reporting summary
Further information on research design is available in the Nature Portfolio Reporting Summary linked to this article.