H2S-driven chemotherapy and mild photothermal therapy induced mitochondrial reprogramming to promote cuproptosis | Journal of Nanobiotechnology
Preparation and characterization of TCuH nanoformulations
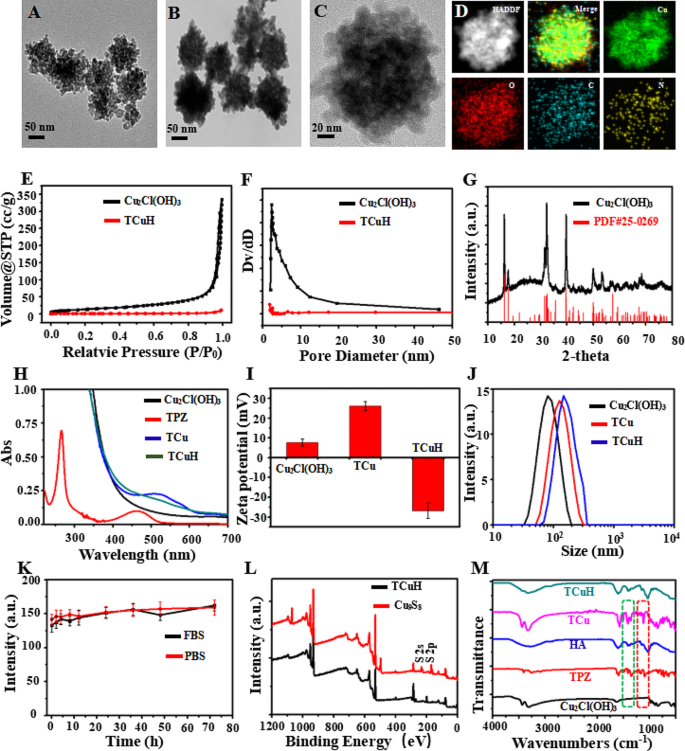
Mesoporous Cu2Cl(OH)3 was synthesized with CuCl2·2H2O, NaOH, and H2O2 by a standard gentle method (see Supporting Information for the detailed protocol). After centrifugation, mesoporous Cu2Cl(OH)3 NPs with uniform particle size were obtained. As shown in Fig. 1A, transmission electron microscopy (TEM) analyses revealed that mesoporous Cu2Cl(OH)3 had a size of 76 nm. Next, the hypoxic prodrug TPZ was sequentially adsorbed into mesoporous Cu2Cl(OH)3 by mechanical stirring, generating TCu. HA was then wrapped in TPZ@Cu2Cl(OH)3 (TCu) to yield TPZ@Cu2Cl(OH)3-HA (TCuH) NPs. Figure 1B and C are TEM images of TCuH NPs, which had a uniform size of 132 nm. Elemental mapping (Fig. 1D) via scanning TEM showed that Cu, O, C, and N were uniformly distributed in the TCuH NPs. Energy-dispersive spectroscopy (EDS) displayed a similar elemental distribution (Figure SI 1). Brunauer–Emmett–Teller images (Fig. 1E and F) revealed the porous structure of mesoporous Cu2Cl(OH)3 via N2 adsorption isotherm analysis. Adsorption hysteresis confirmed the porous structure of mesoporous Cu2Cl(OH)3. The surface area, pore volume and pore size were 63.56 m2/g, 0.02 cm3/g and 2.91 nm, respectively. However, Both the surface area and pore volume were much lower, i ncluding the pore size. Because Cu2Cl(OH)3 was coated by HA, almost no pore size of mesopore Cu2Cl(OH)3 was measured, indicating that HA was coated on pore size. The crystalline nature was confirmed by X-ray diffraction (Fig. 1G), which showed Cu2Cl(OH)3 (PDF#25–0269). The TPZ characteristic absorbance peak at 518 nm in the UV-Vis spectrum of TCu (Fig. 1H) was weakly detectable because of its high HA content. The TPZ loading content was 8.7%, according to UV-Vis (Figure SI 2). The zeta potentials of + 7.6 mV (Cu2Cl(OH)3), + 26.1 mV (TCu), and − 26.8 mV (TCuH) confirmed successful loading of TPZ and HA onto Cu2Cl(OH)3 (Fig. 1I). According to dynamic light scattering, the hydrodynamic diameters of Cu2Cl(OH)3, TCu, and TCuH were 88 nm, 103 nm, and 144 nm, respectively (Fig. 1J). Changes in average particle size were negligible after incubation with 10% fetal bovine serum in water and PBS for 72 h. As shown in Fig. 1K, TCuH maintained good water dispersibility and no visible precipitation; thus, it was stable in a solution of 10% fetal bovine serum in water. Additionally, the composition of TCuH NPs was studied by X-ray photoelectron spectroscopy (XPS, black line), which revealed four characteristic peaks at 285.86 eV (C1s), 399.48 eV (N1s), 532.73 eV (O1s), and 934.02 eV (Cu 2p). Importantly, the valence state of Cu 2p is shown in Figure SI 3; the results confirmed that Cu2+ had reacted with GSH and been reduced to Cu+, which could catalyze H2O2 generation from ·OH through a Fenton-like reaction during CDT. In the Fourier-transform infrared spectrum of TCuH (Fig. 1M), the presence of the characteristic peaks of TPZ and Cu2Cl(OH)3 suggested successful binding between TPZ and Cu2Cl(OH)3. Furthermore, the characteristic peaks of TCuH NPs were similar to HA because of high HA content in the outer layer.
Physical and chemical characterization of Cu2Cl(OH)3 and TCuH NPs. TEM images of Cu2Cl(OH)3 NPs (A) and TCuH NPs (B and C). (D) Scanning TEM image and corresponding elemental mappings of Cu, C, and N in TCuH NPs. (E) N2 adsorption/desorption isotherm of Cu2Cl(OH)3 NPs. (F) Pore size distribution of modified Cu2Cl(OH)3 NPs in N2 adsorption/desorption isotherm. (G) X-ray diffraction pattern of Cu2Cl(OH)3 NPs. (H) UV-vis spectroscopy of Cu2Cl(OH)3, TPZ, TCu and TCuH NPs. (I) Zeta potentials of Cu2Cl(OH)3, TCu and TCuH NPs. (J) Size distributions of Cu2Cl(OH)3, TCu and TCuH NPs. (K) Test of TCuH NP stability in fetal bovine serum and PBS for 72 h. (L) XPS of TCuH NPs before and after treatment with NaHS. (M) Fourier-transform infrared spectra of TPZ, HA, Cu2Cl(OH)3, TCu and TCuH NPs
Sulfidation of TCuH NPs and release of TPZ
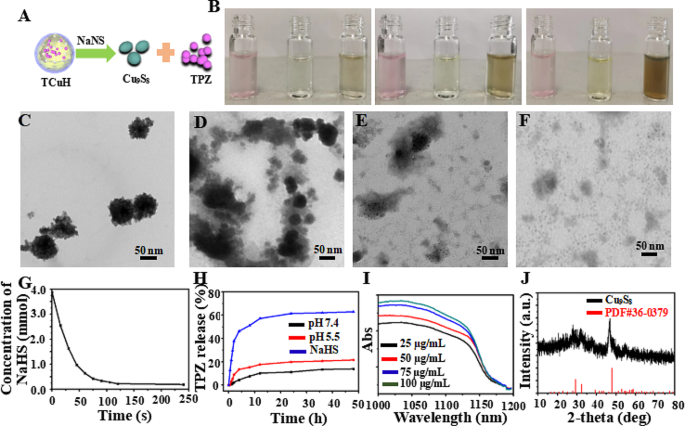
Chemical reactions with TCuH were simulated using sodium hydrosulfide (NaHS) as a H2S-rich microenvironment in vitro. Figure 2A shows the reaction of TCuH with NaHS to produce Cu9S8 (PDF#36–0379, Fig. 1G red line) and release the prodrug TPZ. As indicated in Fig. 2B, the solution color rapidly changed from pink to brown when TCuH reacted with various concentrations of NaHS (0, 0.5, 1, and 3 mmol). Additionally, TCuH reacted with NaHS (3 mmol) at various time intervals to achieve TCuH cleavage, as determined by TEM (Fig. 2C-F). The consumption of NaHS was recorded by UV-Vis, as shown in Fig. 2G; NaHS quantities below 20 µmol were rapidly consumed by TCuH. This consumption provided the conditions that initiated the reaction in Scheme 1*, which reduced oxygen levels at the tumor site. In the hypoxic environment, TPZ was activated to produce the chemotherapeutic drug TPZ-ed. TCuH was subsequently cleaved by NaHS (3 mmol) to release TPZ (Fig. 2H). More than 50% of TPZ was released within 10 h. However, the release of TPZ in PBS solutions with pH 5.5 and 7.4 was less than 20%, far less than that in NaHS solutions. Indicating that NaHS reacted more easily with TCuH to release TPZ. Additionally, the absorption intensity in the near-infrared region increased with increasing Cu9S8 concentration (25, 50, 75 and 100 µg/mL, Fig. 2I), demonstrating that TCuH NPs could react with NaHS. Moreover, the Cu2Cl(OH)3 NPs and NaHS reacted for 30 min to produce Cu9S8, which was consistent with PDF#36–0379 (Fig. 2J).
Characterization of TCuH NPs in aqueous solution and performance in the presence of NaHS. (A) Schematic diagram of TCuH and NaHS reacting to generate the photothermal agent Cu9S8 and release the hypoxia prodrug TPZ. (B) Photographs of TCuH NPs at various concentrations in the presence of NaHS. (C–F) TEM images of TCuH NPs reacted with various concentrations of NaHS (0, 0.5, 1, and 3 mmol). (G) NaHS consumption over time according to TCuH concentration in vitro. (H) TPZ release over time in the presence of pH 7.4, pH 5.5 and NaHS, respectively. (I) UV-Vis spectra of TCuH NPs after incubation with various concentrations of NaHS. (J) X-ray diffraction patterns of reaction products of TCuH NPs after treatment with NaHS (50 µg/mL) for 30 min
In Vitro simulation OH production and photothermal effect
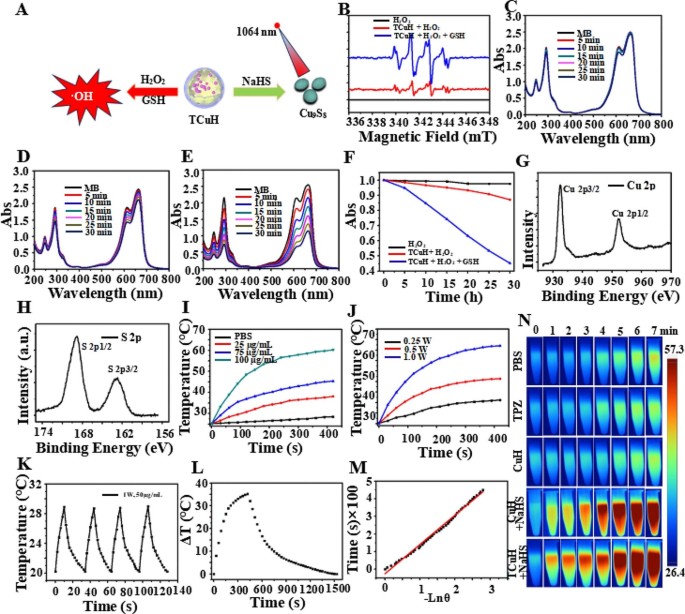
The sulfurization reaction and Fenton-like reaction were simulated in vitro at high levels of GSH (?∼ 10 mmol), H2O2 (?∼ 10 mmol), and H2S (?∼ 3.4 mmol) to produce greater intracellular oxidative stress (Fig. 3A). Cu2+ was reduced to Cu+ by excess GSH, which catalyzed the production of •OH from excess H2O2. First, •OH production was confirmed by using 5,5-dimethyl-1-pyrroline-N-oxide (DMPO) as a free radical trapping agent for electron spin resonance spectroscopy analysis. As shown in Fig. 3B, there were obvious characteristic peaks (i.e., 1:2:2:1 four-line signal) of •OH in the electron spin resonance analysis, indicating that Cu+ could catalyze the production of •OH from H2O2. Moreover, methylene blue (MB) was utilized as a monitoring agent to quantitatively analyze the generation of •OH by UV-Vis. Blue MB was oxidized by •OH to a colorless cationic radical, resulting in reduced UV-Vis absorption at 665 nm. Time-dependent UV-Vis absorption spectra of MB-containing TCuH (30 µg/ml) solution were obtained without GSH and H2O2 (Fig. 3C). There were minimal changes in peak intensity when TCuH (30 µg/mL) was reacted with H2O2 (10 mM), indicating limited •OH production (Fig. 3D). TCuH was reacted with GSH (10 mM) for 5 min and then with H2O2 (10 mmol) to measure time-dependent UV-Vis absorption spectra. As shown in Fig. 3E, the absorption intensity of MB considerably decreased, demonstrating substantial •OH production. Figure 3F was obtained from the normalized data. Notably, a large amount of •OH was only generated in the presence of GSH (10 mmol) and H2O2 (10 mmol). Next, we explored the reaction of TCuH (30 µg/mL) with NaHS (3 mmol) to produce Cu9S8, along with its photothermal properties. As shown in Fig. 1L, compared with XPS of Cu2Cl(OH)3, XPS of Cu9S8 (red line) revealed increased S 2p and S 2s at 168.33 eV and 232.35 eV, respectively. High-resolution XPS showed that Cu 2p 1/2 and Cu 2p 3/2 were valence states in Cu (Fig. 3G), whereas S2p 1/2 and S2p 3/2 were valence states in S2p (Fig. 3H). These results indicated that S had been successfully vulcanized by Cu. Cu9S8 had a strong absorption peak at 1100 nm, suggesting that Cu9S8 exhibits better photothermal properties at 1064 nm, along with robust tissue penetration. Near-infrared II (1000–1400 nm) lasers can penetrate tissue to a depth of 5 mm, which may enable more extensive tumor treatment than conventional lasers with near-infrared I (700–950 nm) penetration depth of 1 mm [39]. We observed a concentration-dependent photothermal pattern of TCuH when the NaHS concentration was held at 3 mM; the temperature increased with increasing TCuH concentration (0, 25, 75 and 100 µg/mL) after illumination (Fig. 3I). In a power gradient experiment, as shown in Fig. 3J, the temperature of a solution comprising TCuH (100 µg/mL) and NaHS (3 mM) increased to the effective treatment temperature (60 °C) within 300 s when the illumination power was 1.0 W/cm2, indicating that TCuH could be used for mild PTT in colon cancer. Additionally, Cu9S8 exhibited good photothermal stability and negligible changes in temperature during four photothermal laser cycles (Fig. 3K). These results showed that TCuH had good near-infrared II photothermal properties after reaction with H2S. The fitted cooling curves (Fig. 3L and M) revealed that the photothermal conversion efficiency (η) of Cu9S8 was 48.3%. Photothermal images of TCuH (100 µg/mL) and NaHS (3 mM) were collected with a thermal imaging camera under extended 1064 nm laser irradiation (0–7 min). As demonstrated in Fig. 3N, the photothermal images gradually became redder, indicating that the temperature was increasing.
CDT with TCuH NPs in an H2O2/GSH environment and photothermal performances of TCuH after incubation with various concentrations of NaHS. (A) Schematic diagram of TCuH and NaHS reacted to generate photothermal agent Cu9S8 and TCuH reduction to Cu+ by excess GSH, which catalyzed production of •OH from excess H2O2. (B) Electron spin resonance spectra of TCuH NPs (10 µg/m) with < 10 mmol GSH/H2O2. (C) Time-dependent UV-Vis absorption spectra of MB-containing TCuH NPs (10 µg/mL) in solution without GSH/H2O2. (D) Time-dependent UV-Vis absorption spectra of MB-containing TCuH NPs (10 µg/mL) in solution with GSH (10 mM) and without H2O2. (E) Time-dependent UV-Vis absorption spectra of MB-containing TCuH NPs (10 µg/mL) in solution with GSH/H2O2 (10 mmol). (F) Normalized absorbance of the MB solution in the presence of TCuH NPs (10 µg/mL) with/without the addition of H2O2 and GSH. (G) HR-XPS of Cu 2p (Cu9S8). (H) HR-XPS of S 2p (Cu9S8). (I–M) Representative temperature evolution curves of aqueous dispersions of TCuH NPs at various concentrations (25, 75, and 100 µg/mL) in the presence of NaHS under 1064 nm laser irradiation at 1.0 W/cm2. (N) Corresponding thermal images of TCuH NPs (100 µg/mL) in the presence of NaHS (3 mmol) under 1064 nm laser irradiation for various times (0–7 min)
In Vitro cellular uptake and therapeutic efficacy
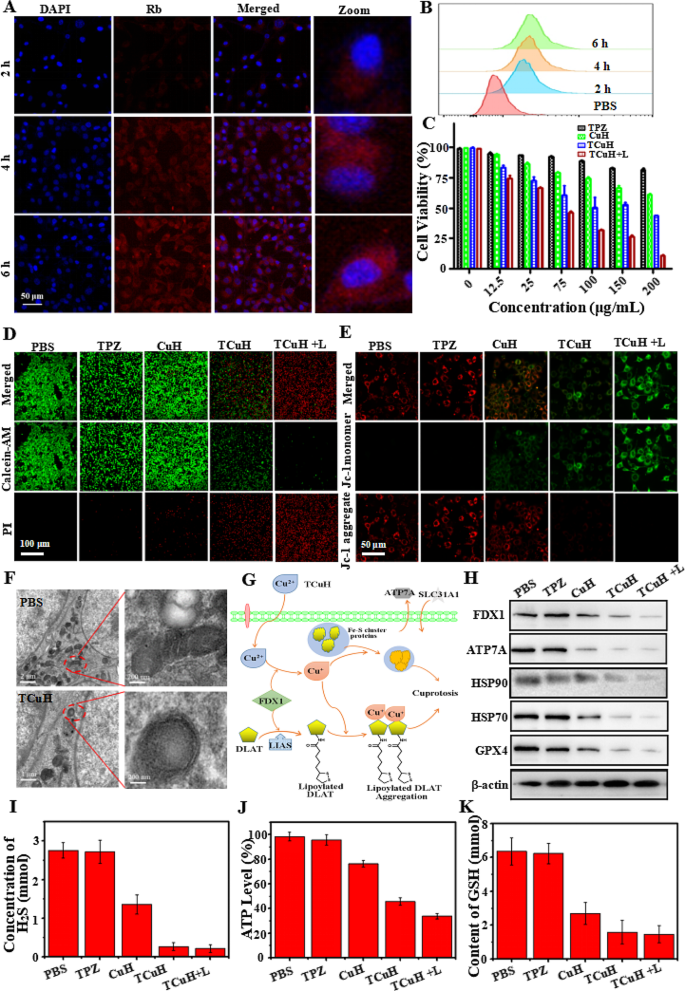
To monitor delivery and intracellular distribution, Rhodamine B (Rb, red fluorescence) was used to assemble RCuH, rather than TPZ. Nuclei were labeled with 4′,6-diamidino-2-phenylindole (DAPI; blue fluorescence) and visualized by a confocal laser scanning microscope (CLSM). As shown in Fig. 4A, an increasing amount of red fluorescence was present in the cytoplasm, suggesting that RCuH was increasingly delivered into cells between 0 and 6 h. The delivery efficiencies (Fig. 4B) of RCuH treatment to CT26 cells were semiquantitatively studied by flow cytometry (FCM). The efficiencies were 23.8%, 48.9%, and 86.5% at 2, 4, and 6 h, respectively. These results confirmed that TCuH could be internalized by cancer cells to achieve therapeutic effects. We immediately measured the viability of TCuH-treated CT26 cells by 3-(4,5-dimethylthiazol-2-yl)-2,5-diphenytetrazolium bromide (MTT) assay. As depicted in Fig. 4C, TPZ did not demonstrate significant cytotoxicity, even at higher concentrations. This result presumably occurred because the tumor site also had a higher O2 content, which hindered conversion of TPZ to its active form (TPZ-ed). Regarding CuH, the high expression of GSH at the tumor site can reduce Cu2+ to Cu+, catalyzing the production of •OH from H2O2 to induce apoptosis in the tumor site. Therefore, minimal toxicity in CT26 cells was observed at CuH levels of ≤ 200 µg/mL. However, although the endogenous H2O2 content reached ?∼ 10 mmol, it was insufficient for CDT; thus, the ·OH content was low and CDT had limited cell-killing effects. For similar reasons, TCuH exhibited relatively low toxicity. In contrast, viability was approximately 31.2% when cells were incubated with TCuH (100 µg/mL) and exposed to 1064 nm laser irradiation for 5 min. This result can be explained by the Cu2Cl(OH)3-mediated consumption of H2S to produce photothermic Cu9S8. When the H2S content decreased to 20 µmol, the Scheme 1* reaction occurred in the tumor microenvironment, further reducing the O2 content and activating TPZ to generate TPZ-ed. Importantly, the low O2 levels hindered ATP production, preventing cells from producing sufficient HSPs to tolerate other stimuli. The decrease in HSPs provided favorable conditions for enhancing the efficacy of mild PTT. Furthermore, PTT can enhance the effects of CDT. The increased amount of Cu+ in tumor cells induces the formation of Fe-S clusters, resulting in cuproptosis. Importantly, Cu2+ binds to lipoacylated dihydrolipoamide S-acetyltransferase (DLAT), inducing DLAT heteropolymerization. The resulting insoluble DLAT has cytotoxic effects and induces cell death, leading to cuproptosis. Simultaneously, Cu2+ generates highly catalytic Cu+ under conditions of increased GSH expression, which can catalyze H2O2 to produce highly toxic hydroxyl radicals (·OH) during chemodynamic therapy (CDT), thereby inducing apoptosis and promoting cuproptosis. To confirm the reactive oxygen species (ROS) production capacity of TCuH NPs in CT26 cells. The non-fluorescent 2’, 7’-dichlorofluorescein diacetate (DCFH-DA) was used as a ROS indicator based on the conversion of 2’, 7’-dichlorofluorescein (DCF, green fluorescence). As shown in Figure SI 4A, we measured the average intensity of ROS signals in CT26 cells treated with various NPs (PBS, TPZ, TCu, TCuH, and TCuH + 1064 nm laser). In the PBS and TPZ groups, CT26 cells stained with DCFH-DA showed very weak or no green fluorescence under a CLSM; conversely, the TCu, TCuH, and TCuH + 1064 nm laser groups exhibited obvious green fluorescence. Therefore, the consumption of endogenous H2S promotes •OH formation. Importantly, the TCuH + 1064 nm laser group exhibited stronger fluorescence than the TCu and TCuH groups, suggesting that the photothermal effect of TCuH after the H2S reaction promoted •OH production in CT26 cells. Additionally, quantitative analysis of •OH generation in different groups was performed using Image-Pro Plus 6.0. As shown in Figure SI 4B, the average fluorescence intensity in the TCuH + 1064 nm group was 3.58-fold greater than in the TCu group and 2.12-fold greater than in the TCuH group. These results indicated that H2S depletion and the photothermal effect could promote •OH formation in CT26 cells. Furthermore, to visually observe live/dead status among CT26 cells in the above groups, live cells were stained with calcein-AM (green fluorescence) and dead cells were stained with propidium iodide (red fluorescence). As shown in Fig. 4D, cells in the PBS, TPZ, and TCu groups showed minimal red fluorescence, indicating that PBS, TPZ, and TCu alone could not effectively kill CT26 cells. However, co-incubation with TCuH and TCuH + 1064 nm laser constituted synergistic treatment, which led to extensive cell death. In the TCuH + 1064 nm laser group, ROS production and the chemotherapeutic effect of TPZ were enhanced; nearly all cells died. FCM analysis indicated that under laser-irradiated TCuH conditions, the apoptosis rate reached 96.5%; this was 8.55-fold, 4.98-fold, and 1.86-fold higher than in the TPZ, TCu, and TCuH groups, respectively (Figure SI 5 A and B). Thus, the combined use of CDT with cuproptosis, PTT, and chemotherapy produced a greater killing effect than any of the treatments alone.
HeLa cells mitochondrial dysfunction was treated with PBS, TPZ, CuH, TCuH and TCuH + L (100 µg/mL) for 6 h by JC-1 assay. As shown in Fig. 4E, the mitochondria membrane of PBS or TPZ-treated Hela cells showed bright red fluorescence, indicating that the mitochondria were in a high-potential, healthy state. Oppositely, TCuH + L significantly depolarized mitochondrial membrane potential showing the highest fluorescence of green, demonstrating mitochondria were dysfunctional, unhealthy status and low potential. In addition, CuH and TCuH treated with Hela cells displayed two kinds of fluorescence (green monomer and red aggregate), suggesting that mitochondrial function wsa sub-optimal health.The morphological changes in CT26 cells treated with PBS or TCuH + 1064 nm laser were further explored by Bio-TEM. Figure 4F shows that mitochondria were intact with in PBS group, whereas severe damage was present among mitochondria in the TCuH + 1064 nm laser group; the damage mainly consisted of increased membrane density, overall mitochondrial shrinkage, and reduced or absent mitochondrial cristae. Cuproptosis contributed to TCuH-induced cell death through the downregulation of Fe-S cluster proteins (Fig. 4G). For example, the reductase FDX1 acts as an upstream regulator of protein thioacylation (e.g., involving DLAT). Additionally, FDX1 reduces Cu2+ to Cu+, leading to the inhibition of Fe-S cluster protein synthesis and induction of cuproptosis [40]. There are two requirements for cuproptosis: copper content and copper release [41]. Figure 4H shows the expression levels of cuproptosis-related biomarkers (HSP70, HSP90, FDX1, and ATP7A) in CT26 cells treated with PBS, TPZ, TCu, TCuH, or TCuH + 1064 nm laser, as determined by western blotting. The protein expression of HSP70/90 should gradually increase with increasing copper content, thereby enhancing the effect of PTT. However, the in-situ copper ion-based consumption of H2S in the tumor led to activation of the Scheme 1 * reaction, promoting O2 consumption and decreasing ATP synthesis. A similar trend was observed for ATP7A, which lowered the expression levels of copper-specific efflux proteins. There was sufficient copper loading to promote the occurrence of cuproptosis. Concurrently, Cu2+ was reduced to Cu+ under conditions of increased GSH expression, which catalyzed •OH production from H2O2 and diminished GPX4 protein levels. Figure 4I shows the change in H2S content after CT26 cells had been incubated with PBS, TPZ, TCu, TCuH, or TCuH + 1064 nm laser. The H2S absorbance at 450 nm was measured by an enzyme-labeling method, and the H2S concentration was calculated. The H2S content in CT26 cells was almost unchanged after TPZ treatment, and it was reduced by 50.9% after TCu treatment. However, the H2S contents in CT26 cells treated with TCuH and TCuH + 1064 nm laser were reduced by 90.4% and 92.3%, respectively. These results indicated that after enrichment of a large number of copper carriers in CT26 cells, depletion of a large amount of H2S promotes O2 depletion, activating the hypoxia prodrug to become active TPZ-ed while inhibiting ATP synthesis (Fig. 4J). Briefly, after sufficient depletion of H2S content, mitochondrial reprogramming was induced, which stimulated oxygen consumption by colonic epithelial cells. Moreover, H2S oxidation in mitochondria altered cellular bioenergetics, inducing reductive transition that involved NAD/NADH redox pairs. Subsequently, the lack of electron receptors led to deficiencies in uridine and L-aspartic acid, as well as the enhancement of L-glutamine-dependent reductive carboxylation; these conditions exacerbated hypoxia in the tumor microenvironment. The GSH of CT26 cells treated with PBS, TPZ, TCu, TCuH and TCuH + 1064 nm laser. As shown in Fig. 4K, Cu2+ reduction to Cu+ was diminished under conditions of increased GSH expression, further catalyzing •OH production from H2O2.
(A) CLSM images of CT26 cells treated with RCuH for 2, 4, and 6 h at 37℃, respectively. (B) Flow cytometry profiles of CT26 cells incubated with RCuH for 2, 4, and 6 h at 37℃, respectively. (C) In vitro MTT-measured toxicities of TPZ, TCu, TCuH, and TCuH + 1064 nm laser (shown as + L in the figure) for 24 h. (D) Live/dead assay of CT26 cells incubated with PBS, TPZ, CuH, TCuH and TCuH + L (100 µg/mL) for 6 h. (E) Intracellular JC-1 assay of HeLa cells after different treatments with PBS, TPZ, CuH, TCuH and TCuH + L (100 µg/mL) for 6 h. (F) Representative Bio-TEM images of CT26 cells before and after treatment with TCuH + L. Red oval indicates location of mitochondria. (G) Schematic illustration of the possible mechanism by which TCuH promotes cuproptosis. (H) Western blot analysis of expression levels of HSP70, HSP90, FDX1, ATP7A, and GPX4 after incubation with PBS, TPZ, CuH, TCuH, or TCuH + L (100 µg/mL) for 24 h. (I) Quantitative comparison of dissolved H2S levels among CT26 cells treated with PBS, TPZ, CuH, TCuH, or TCuH + L (100 µg/mL) for 24 h. (J) Quantitative comparison of dissolved ATP levels among CT26 cells treated with PBS, TPZ, CuH, TCuH, or TCuH + L (100 µg/mL) for 24 h. (K) Quantitative comparison of dissolved GSH levels among CT26 cells treated with PBS, TPZ, CuH, TCuH, or TCuH + L (100 µg/mL) for 24 h
Antitumor efficacy of TCuH in vivo
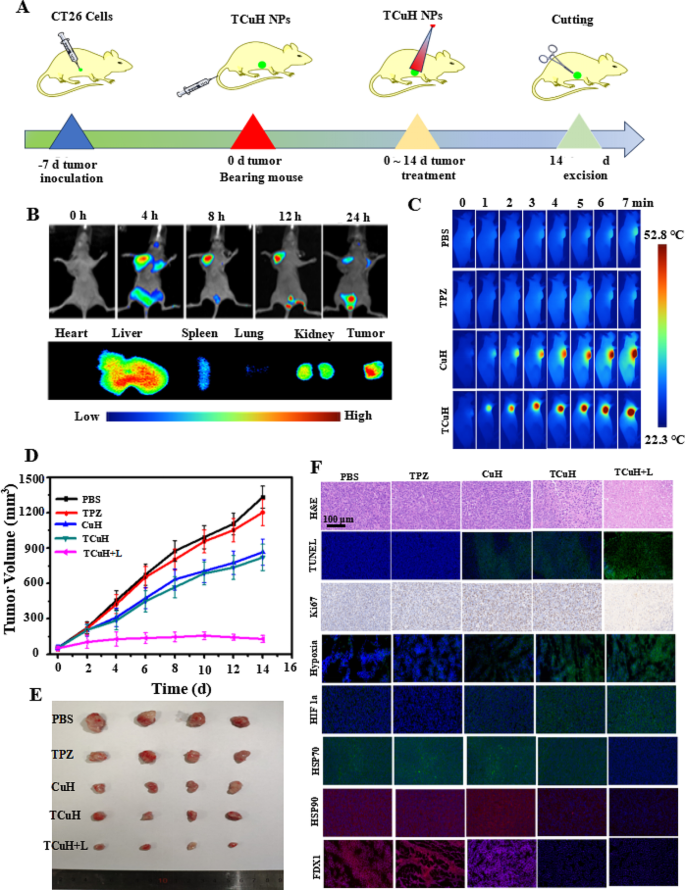
We used CT26 cells to establish a subcutaneous tumor model in BALB/c nude mice, with the goal of characterizing the synergistic inhibitory effect of TCuH on colon cancer. All animal procedures were performed in accordance with the Guidelines for Care and Use of Laboratory Animals of National Institutes of Health (NIH publication no. 85 − 23, revised 1996) and approved by the Animal Ethics Committee of Sun Yat-sen University (Guangzhou, China). The mice were randomly divided into five groups (n = 5 mice per group): PBS, TPZ, TCu, TCuH, and TCuH + 1064 nm laser. Treatments were administered through the tail vein, once every other day for five total treatments; the total dose was 5 mg/kg (Fig. 5A). Next, in vivo fluorescence imaging techniques were used to track dynamic in vivo changes in TCuH; this allowed determination of the appropriate timing for laser irradiation to induce PTT in the presence of H2S. The fluorescence agent indocyanine green (ICG) was used (rather than TPZ) to synthesize ICuH; fluorescence signal aggregation after tail vein injection was observed in the tumor by a small animal imaging instrument. As depicted in Fig. 5B, the ICG fluorescence signal intensity reached a peak at 12 h after injection, then gradually decreased. The fluorescence peak of ICG was present in the tumor at 36 h after dissection, indicating that TCuH can accumulate in tumors for up to 36 h. The liver and kidney have contained large amounts of ICuH that could easily be metabolized by the kidney and reduce toxic side effects. Consequently, we set the laser irradiation time of TCuH to 12 h after injection. As shown in Fig. 5C, the tumor temperature rapidly increased after 1064 nm laser irradiation, indicating a high rate of TCuH activation under a high concentration of H2S. In the PBS and TPZ groups, the temperature generally remained below 30℃ with ≤ 7 min of irradiation, indicating that TPZ was not an effective photothermal agent. In mild PTT, the treatment temperature was set to approximately 52.8 °C and the drug was injected into the tail vein for 12 h. The Cu contents in blood and tumor were determined by inductively coupled plasma mass spectrometry (ICP-MS). The results showed that the Cu content in blood gradually decreased to 10 µg/mL after approximately 12 h, with a blood circulation half-life of 2.58 h (Figure SI 6); the Cu content in the tumor gradually decreased after ?∼ 12 h (Figure SI 7). At 12 h after tail vein injection, the tumors were treated with mild PTT involving a single instance of 1064 nm laser irradiation; the temperature reached ?∼ 52.8 °C. Weight and tumor size were measured every other day for 14 days of treatment. Concurrently, TCuH was injected every other day, and 1064 nm laser irradiation was performed 12 h after injection. As shown in Fig. 5D, tumors in the TPZ and PBS groups exhibited nearly identical sizes. In contrast, the rates of inhibition in the TCu, TCuH, and TCuH + 1064 nm laser groups after 14 days of treatment were 35.5%, 39.4%, and 92.3%, respectively. The results indicated that TCuH can produce Cu9S8 with excellent photothermal conversion at high concentrations of H2S, which can inhibit tumor growth in combination with H2S-driven chemotherapy and mild photothermal therapy induced mitochondrial reprogramming to promote cuproptosis. There were no significant changes in mouse body weight during the different treatments. In vitro tumor weights and image showed that the results of treatment with different materials were similar to the findings depicted in Fig. 5D, confirming the excellent antitumor effect of TCuH + 1064 nm laser treatment. Mouse body weight steadily increased, indicating no significant delay in tumor growth (Figure SI 8). Notably, the TCuH group displayed the greatest inhibitory effect on tumor growth, with a statistically significant difference relative to the other groups (Figures SI 9 and Fig. 5E).
To explain the potential therapeutic mechanism of TCuH, histological analysis was performed to investigate TCuH molecular functions in vivo. Compared with the PBS group, the TPZ, TCu, TCuH, and TCuH + 1064 nm laser groups demonstrated higher terminal deoxynucleotidyl transferase-mediated dUTP nick-end labeling (TUNEL) and hematoxylin and eosin (H&E) signals of apoptosis, along with a lower percentage of Ki67-positive cells (Fig. 5F). Apoptosis and necrosis among tumor cells were greater in the TCuH + 1064 nm laser group under H2S activation, compared with the other groups. To explore the antitumor mechanism of TCuH + 1064 nm laser under H2S activation, in vivo immunofluorescence assays were used to measure hypoxia and the expression levels of HIF-1a, HSP70, HSP90, and FDX1 in tumors. Consistent with the in vitro results, the most prominent aggregation of HIF-1a and highest level of hypoxia were observed in tumors treated with TCuH + 1064 nm laser under H2S activation. Higher green fluorescence intensity indicated lower O2. As The high-affinity Cu ions reacted with excess H2S in the tumor, resulting in a rapid reduction in H2S content to < 20 µmol, which activated mitochondrial reprogramming and stimulated oxygen consumption by colonic epithelial cells. Subsequently, the lack of electron receptors led to deficiencies in uridine and L-aspartic acid, as well as the enhancement of L-glutamine-dependent reductive carboxylation; these conditions exacerbated hypoxia in the tumor microenvironment (Scheme 1*). Heat shock protein (HSP70/90) is an ATP-dependent chaperone, and ATP synthesis is inhibited when O2 levels are reduced. Therefore, the HSP70/90 content decreases with decreasing O2 content. This is also a prerequisite for mild PTT therapy. Moreover, loss of FDX1 was observed in tumors treated with TCuH + 1064 nm laser under H2S activation, confirming the presence of cuproptosis in vivo. The results showed that TCuH + 1064 nm laser treatment could effectively inhibit tumor growth via H2S-driven chemotherapy and mild photothermal therapy induced mitochondrial reprogramming to promote cuproptosis.
In vivo immune activation and exertion of potent antitumor efficacy. (A) Schematic of the treatment protocol. Arrows indicate times of intravenous injection (TCuH NPs, n = 5). (B) Real-time bio-distribution images of ICuH NPs before and after injection. (C) In vivo infrared thermal imaging images of CT26 tumors in mice treated with TCuH NPs upon 1064 nm laser irradiation at 8 h after injection. (D) Tumor growth assessment and (E) photographs of excised tumor tissues. (F) H&E, TUNEL, Ki67, hypoxia, HIF-1a, HSP70, HSP90, and FDX1 staining in tumor sections from PBS, TPZ, TCu, TCuH, and TCuH + 1064 nm laser groups. Data are presented as means with standard deviations (n = 5)
Biosafety evaluation of TCuH NPs
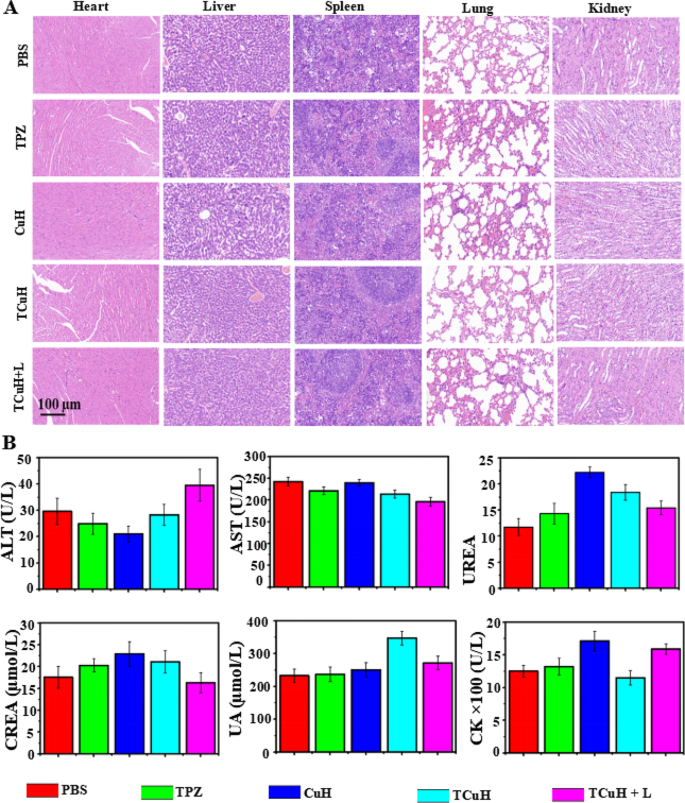
Although the cytotoxicity of TCuH + 1064 nm treatment was difficult to detect through histological assays, its practical application requires consideration of potential side effects. Consequently, PBS, TPZ, CuH, TCuH and TCuH + 1064 nm laser treatments were injected into healthy mice through the tail vein (total dose, 5 mg/kg) to explore biosafety in vivo. As depicted in Fig. 6A, H&E staining of major organs showed no morphological changes in any group, suggesting no obvious side effects of TCuH NPs and sufficient safety in vivo. We also investigated the blood physiological and biochemical parameters of mice in each treatment group. The results (Fig. 6B) showed that alanine transaminase, urea, serum creatinine, blood uric acid, and creatine kinase did not significantly differ among groups, confirming that the CuH NPs have minimal toxicity.


